The network for creativity
Join 1.25M professional creatives like you
Connect with clients, get discovered, and run your business 100% commission-free
Creatives on Contra have earned over $150M and we are just getting started
Back to feedPost

🚀 Now Offering Power BI Dashboard Development on Contra!
I'm excited to announce that I've officially launched my Power BI Dashboard Development service on Contra.
If you're looking to transform raw data into interactive, insightful, and visually appealing dashboards, I'd love to help.
📊 What I can help with:
• Power BI Dashboards
• KPI & Performance Tracking
• Sales & Business Reports
• Data Visualization
• Data Cleaning & Transformation
• Custom Analytics Solutions
🛠️ Tools: Power BI | Excel | SQL | Python
As a Data Analyst and BCA (Data Science) student, I'm continuously building projects and helping businesses make data-driven decisions through clear and actionable insights.
If you need a dashboard or analytics solution, feel free to reach out. Looking forward to collaborating with amazing clients and teams!
#Contra #PowerBI #DataAnalytics #DataVisualization #BusinessIntelligence #DashboardDesign #Freelance #DataAnalyst #Excel #SQL #Python #OpenToWork #Analytics #DataScience #PowerBIDashboard 🚀

The network for creativity
Join 1.25M professional creatives like you
Connect with clients, get discovered, and run your business 100% commission-free
Creatives on Contra have earned over $150M and we are just getting started


Related posts

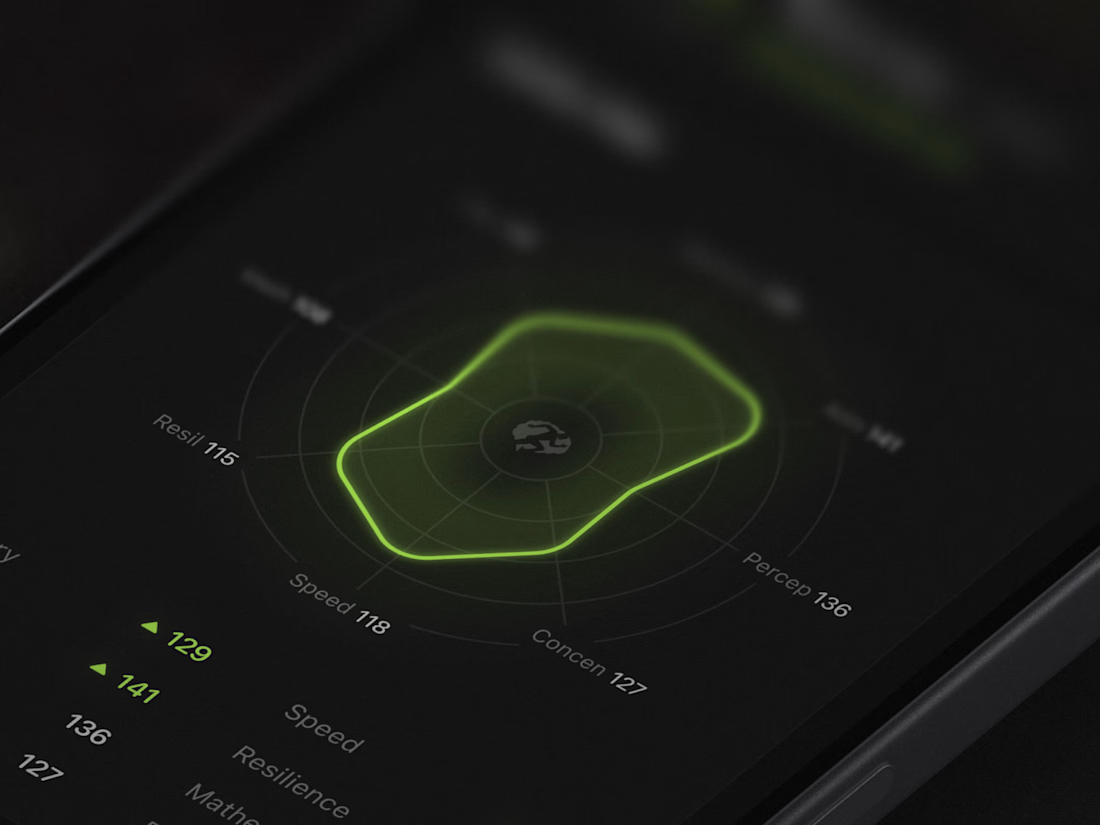
Designed the analytics dashboard screen that users get after finishing a brain training session 🔥


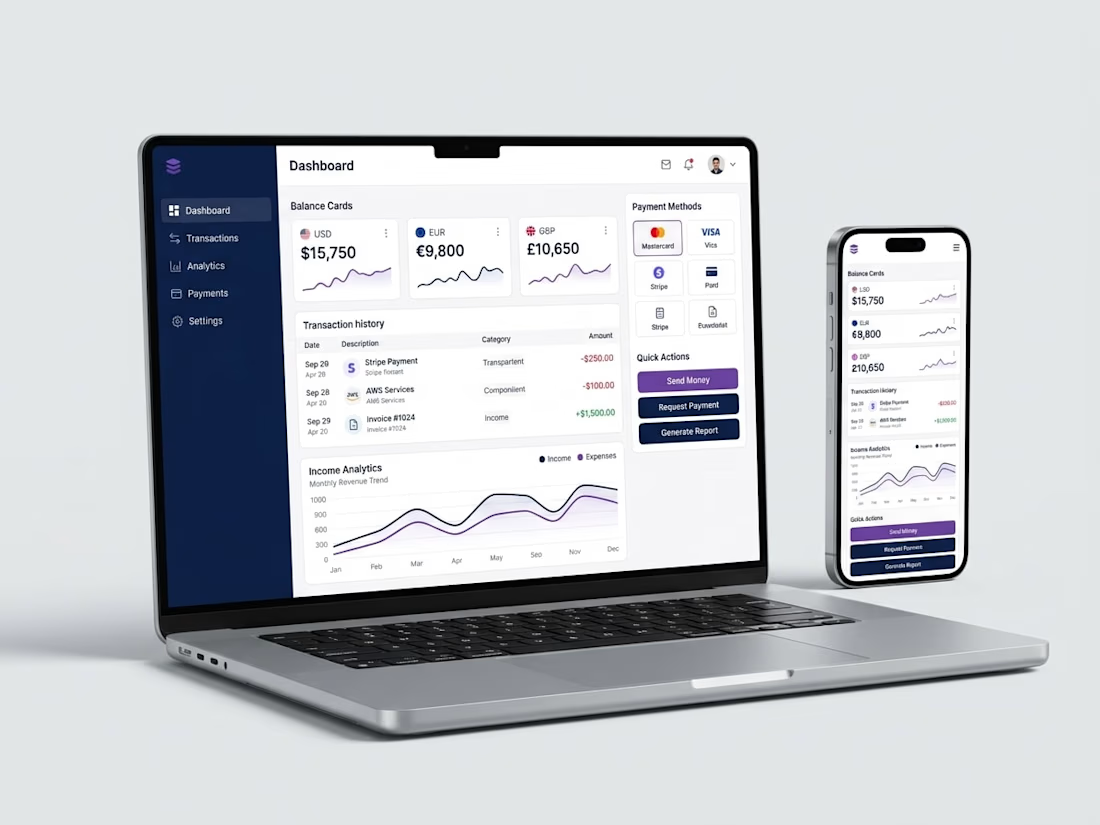
A premium, responsive fintech dashboard featuring financial analytics, payment management, transaction tracking, and a modern user-friendly interface.

The multi-currency balance cards at the top are easy to read. Good use of the navy sidebar too.

Patient Experience & Quality of Care Dashboard
Understanding healthcare performance goes beyond patient numbers and clinical activity. Patient satisfaction, waiting times and service quality are equally important.
This Power BI dashboard brings together key patient experience and quality indicators to help healthcare administrators, facility managers and quality improvement teams evaluate service delivery.
It explores average patient satisfaction, satisfaction response rates, waiting times across departments, monthly satisfaction trends, discharge patterns and satisfaction differences across encounter types.
The objective is to help healthcare facilities identify potential service gaps, understand variations in patient experience and recognise areas that may require improvement.
By turning patient experience data into clear, actionable insights, the dashboard supports better-informed decisions around service delivery and quality improvement.