The network for creativity
Join 1.25M professional creatives like you
Connect with clients, get discovered, and run your business 100% commission-free
Creatives on Contra have earned over $150M and we are just getting started
Back to feedPost


A data-driven quarterly business review dashboard built to track key performance metrics — monthly revenue trends, customer churn rate, and support response time. This project demonstrates data analysis, visualization, and business intelligence reporting skills using Python for data processing and chart generation.


The network for creativity
Join 1.25M professional creatives like you
Connect with clients, get discovered, and run your business 100% commission-free
Creatives on Contra have earned over $150M and we are just getting started







Related posts

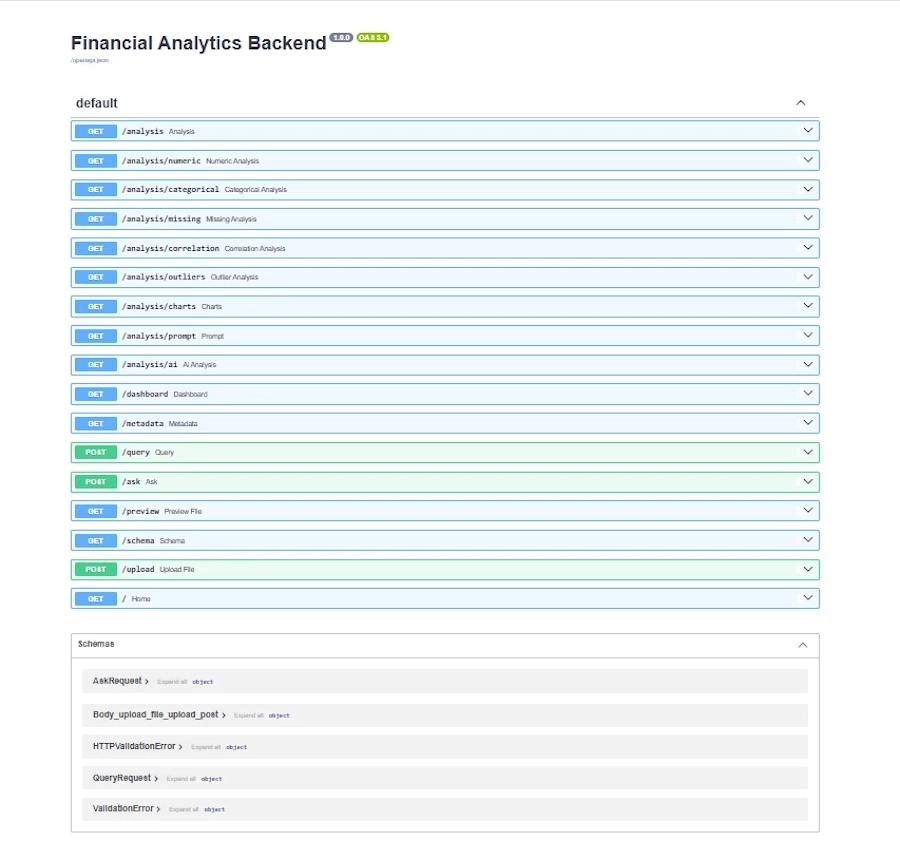
AI-powered financial analytics platform built with FastAPI, Pandas, DuckDB, and Gemini API for data analysis, REST APIs, natural-language-to-SQL queries, and automated business insights.



Made the dashboard for web application and used task management systems like Jira or Asana to improve efficiency and speed of work.
🤔 The problem was simple: new users opened the app, saw an empty workspace and had no idea where to start. So I turned the home page into a place that tells you what to do next. It allows to pick a template and you're set up in one click, follow a short checklist to finish onboarding, and check your inbox to see who's working on what without digging through boards.


Great fix for empty workspaces. Any plans to add a step-by-step walkthrough on first login to guide them through each section?

Hiring always looks simple on paper — post a job, review resumes, take interviews, and make an offer. ✅
But anyone who has actually been involved in hiring knows… it’s not that simple. 😅
You have resumes coming from multiple sources, so many follow-ups, interview scheduling, feedback tracking, coordination with different people, and then the never-ending question —
“What’s the status of this candidate?”
I’ve seen HR teams and hiring managers struggle with scattered data, missed follow-ups, and lack of visibility.
That’s why I’m working on a Hiring Management Portal — a simple, organized way to manage the entire hiring process from job posting to onboarding.
The goal isn’t to add another complicated tool.
It’s to make the hiring process easier to manage, easier to track, and easier for everyone involved.
Would you find a tool like this useful in your organization?
And more importantly:
What’s the biggest challenge you face while hiring today?
I’d genuinely love to hear your experiences. 👇