The network for creativity
Join 1.25M professional creatives like you
Connect with clients, get discovered, and run your business 100% commission-free
Creatives on Contra have earned over $150M and we are just getting started
Back to feedPost
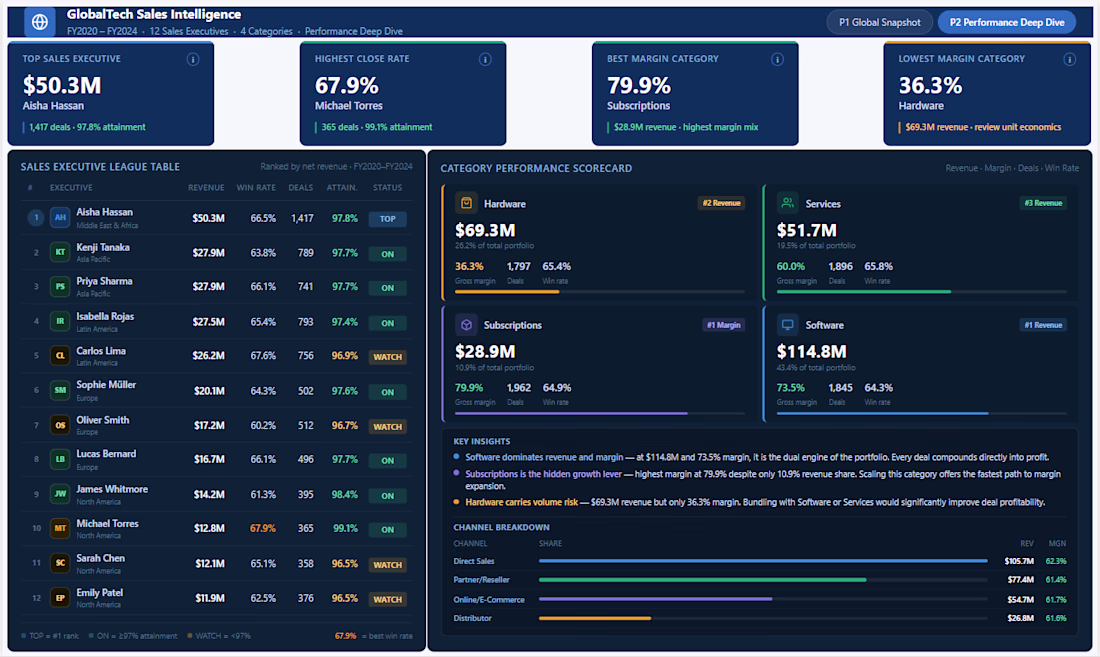
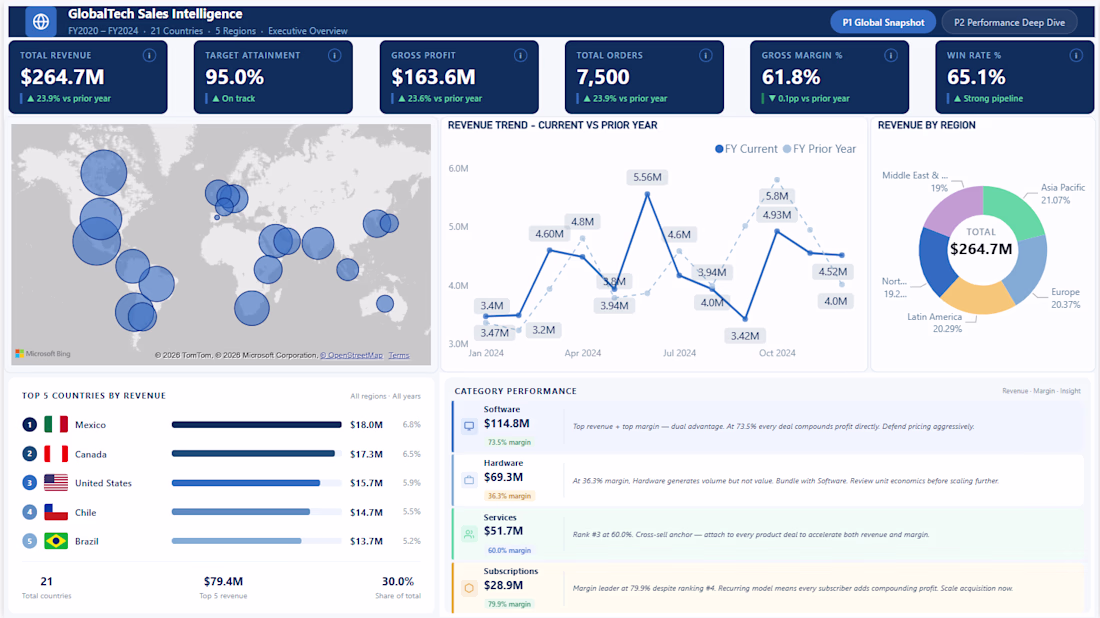
A sales analytics Power BI dashboard built to track revenue performance, category breakdown and subscription metrics for business leadership. The report covers current vs prior year revenue trends, margin analysis and category level performance across Hardware, Software, Services and Subscriptions.
The build features KPI summary cards, a revenue trend line chart with year over year comparison, bubble map for geographic performance, category performance breakdown and a dynamic narrative summary highlighting key insights automatically.
Designed for executive audiences who need to walk into a meeting and immediately understand where the business is growing and where it is not. Built using DAX measures, Power Query data transformation and custom visual layout engineering inside Power BI Desktop.
The network for creativity
Join 1.25M professional creatives like you
Connect with clients, get discovered, and run your business 100% commission-free
Creatives on Contra have earned over $150M and we are just getting started
Related posts
Blockly – Blockchain Dashboard
Blockchain dashboard designed to simplify complex on-chain data into clear, actionable insights. Built for clarity and performance, Blockly enables users to monitor transactions, analyze network activity, and track assets across multiple blockchains—all from a single, intuitive interface.
Have a project? Let's Discuss and Collaborate: https://cal.com/orenji-studio/30min?overlayCalendar=true
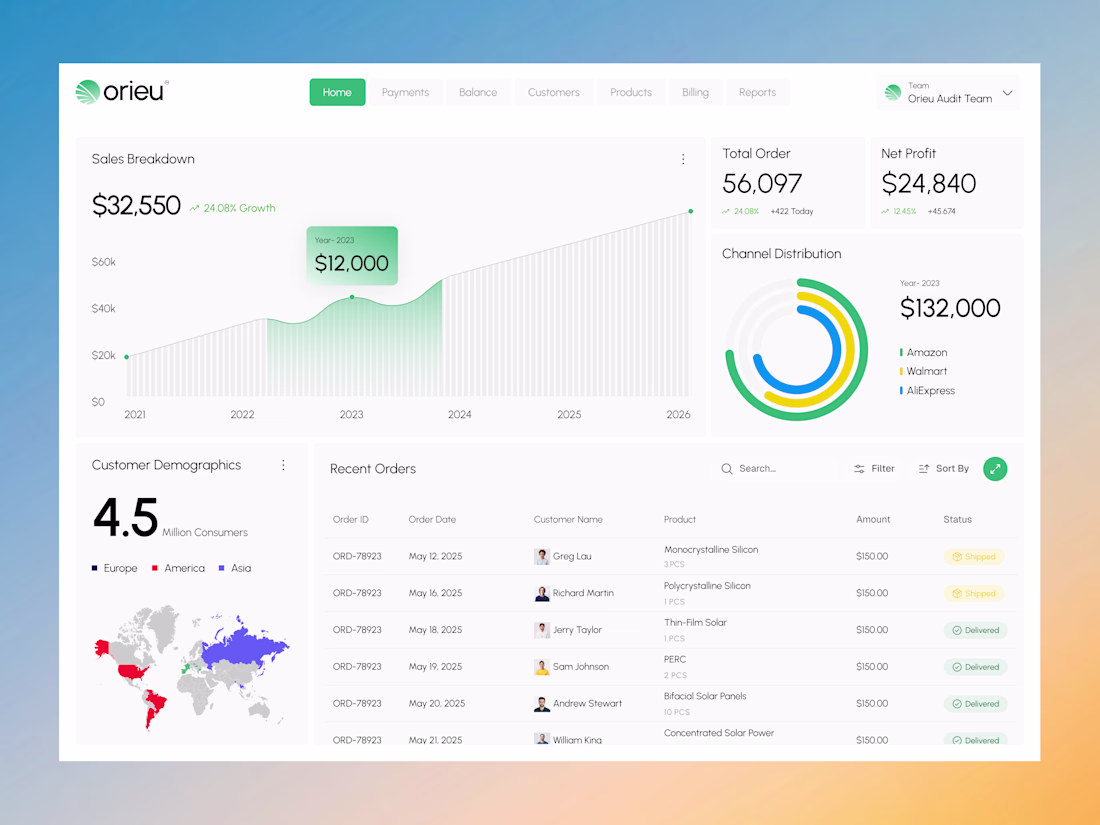
Most dashboards become harder to use as they scale.
Orieu was designed to move in the opposite direction.
A solar sales intelligence dashboard built to simplify how renewable energy businesses track revenue, monitor orders, analyze customer activity, and manage operational performance.
The experience focuses on:
• Clear analytics visualization
• Lightweight navigation
• Structured operational workflows
• Minimal eco-inspired UI
• Faster decision-focused interaction
The challenge wasn’t adding more features.
It was organizing complexity into something users can understand instantly.
Because in SaaS products, usability directly impacts business efficiency.
Currently available for SaaS dashboard, analytics platform, and web app design collaborations. Let’s build a product your users actually enjoy using.
Product DesignUI DesignAdobe PhotoshopFigmaAdobe IllustratordashboarddesignsolarsystemAI VIsual Designersolarenergydesign
Clean 👌🏻
Trending
Claude
Claude has entered the design space. How are you using Claude Design?
Contra University
Learn from expert creatives how to earn more using next-gen AI tools.
creativeaiflow
Creative AI workflows are evolving. What tools do you use, and what are their strengths and weaknesses?
portfolioreview
The best portfolios tell a story, not just show a grid. Share yours for feedback.
freelancerlife
Freelancer life is wins, pivots, and everything in between. What’s yours right now?