The network for creativity
Join 1.25M professional creatives like you
Connect with clients, get discovered, and run your business 100% commission-free
Creatives on Contra have earned over $150M and we are just getting started
Back to feedPost
SaaS Revenue, Growth & Retention Intelligence Dashboard
Enterprise Analytics Architecture & Decision System
Project Overview
This project is an end-to-end analytics system designed to help subscription-based companies answer one core question:
Is our revenue growth durable, predictable, and defensible — or are we masking structural churn with acquisition?
Unlike reporting dashboards that focus on surface-level KPIs, this project is built as a decision-support system for leadership, finance, growth, and retention teams.
It demonstrates how analytics should be structured, validated, and deployed to solve real business risks, not just visualize data.
Business Context & Company Type
This analytics solution is designed for:
SaaS & subscription-based businesses
B2B software companies (Series A → pre-IPO)
Organizations with recurring revenue, churn risk, and customer lifecycle complexity
The dataset represents a company with:
Account-based subscriptions
Multiple billing cycles and plan tiers
Feature usage and behavioral signals
Support tickets impacting churn
Explicit churn events
This mirrors real-world RevOps and Growth Analytics environments.
Core Business Problems Solved
This dashboard addresses four enterprise-critical risks:
False Growth Visibility Separates true revenue growth from churn-offset acquisition.
Revenue Leakage Blindness Identifies where ARR and MRR are lost by plan, customer type, and behavior.
Retention & Churn Misdiagnosis Connects churn outcomes to behavioral and operational signals.
Unpredictable Cash Flow Improves forecasting through billing cycle and subscription intelligence.
Analytics Philosophy
This project strictly follows analytics maturity standards, not ad-hoc dashboarding.
LEVEL 0: MASTER FLOW OVERVIEW
Business Understanding → Data Audit → Data Preparation → Data Modelling → KPI & Metrics → Analysis & Insights → Visualization & Storytelling → Validation → Deployment → Business Adoption
This is the only analytics flow that scales. Everything else is a structured breakdown of this.
LEVEL 1: MASTER FLOWS (Enterprise Analytics Framework)
Each master flow mitigates a specific enterprise risk.
1. Business Understanding & Value Definition
Risk Solved: Analytics without decision impact
Defined executive, finance, growth, and retention use cases
Mapped KPIs directly to leadership decisions
Explicitly rejected vanity metrics
Outcome: Analytics exists to drive action, not reporting.
2. Data Audit & Feasibility Assessment
Risk Solved: Unreliable or misleading insights
Assessed raw datasets for:
Grain consistency
Missing identifiers
Temporal limitations
Identified proxy metrics vs factual metrics
Flagged analytical constraints early
Outcome: No false confidence from weak data.
3. Data Preparation & Transformation
Risk Solved: Inconsistent definitions across teams
Cleaned and standardized subscription, account, churn, usage, and support data
Normalized date logic using a dedicated Date dimension
Created analysis-ready structures without altering raw facts
Outcome: Stable foundation for scalable analytics.
4. Analytical Data Modelling
Risk Solved: Performance bottlenecks and ambiguous logic
Star-schema–oriented analytical model
Clear separation of:
Fact tables (Subscriptions, Churn, Usage, Tickets)
Dimension tables (Account, Date, Plan, Feature)
Relationships designed for analytical clarity, not convenience
Outcome: High-performance, explainable model.
5. KPI, Metrics & Business Logic Layer
Risk Solved: Multiple versions of truth
Defined metrics at business meaning level:
ARR, MRR, Net Revenue Growth
Logo Churn vs Revenue Churn
Activation and retention proxies
Explicitly documented assumptions where proxies are used
Ensured consistent filters across all pages
Outcome: One version of truth for leadership.
6. Exploratory Analysis & Insight Discovery
Risk Solved: Reactive decision-making
Identified:
Revenue concentration risks
Retention decay patterns
Plan-level churn exposure
Tested behavioral correlations with churn and retention
Outcome: Early warning signals instead of post-mortems.
7. Visualization & Dashboard Engineering
Risk Solved: Dashboards that don’t get used
Dashboards are structured by decision ownership, not data domains.
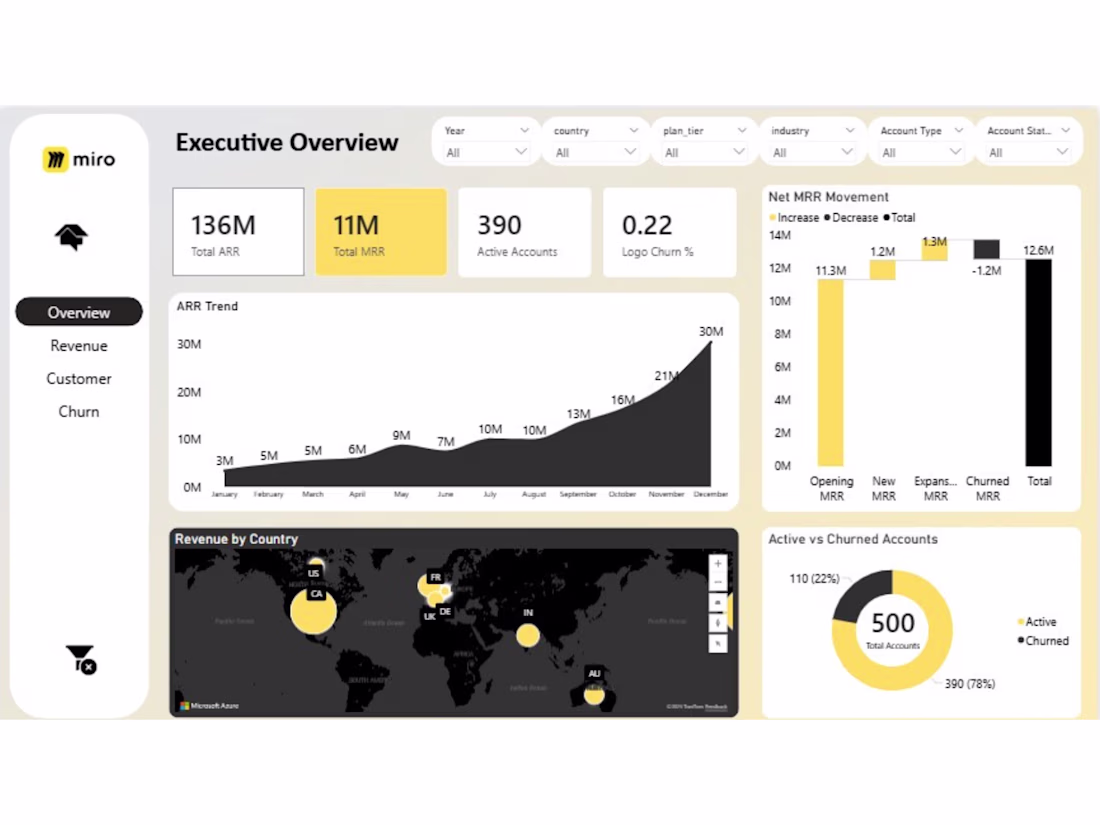
Page 1: Executive Overview
30-second business health check for CEOs and founders.
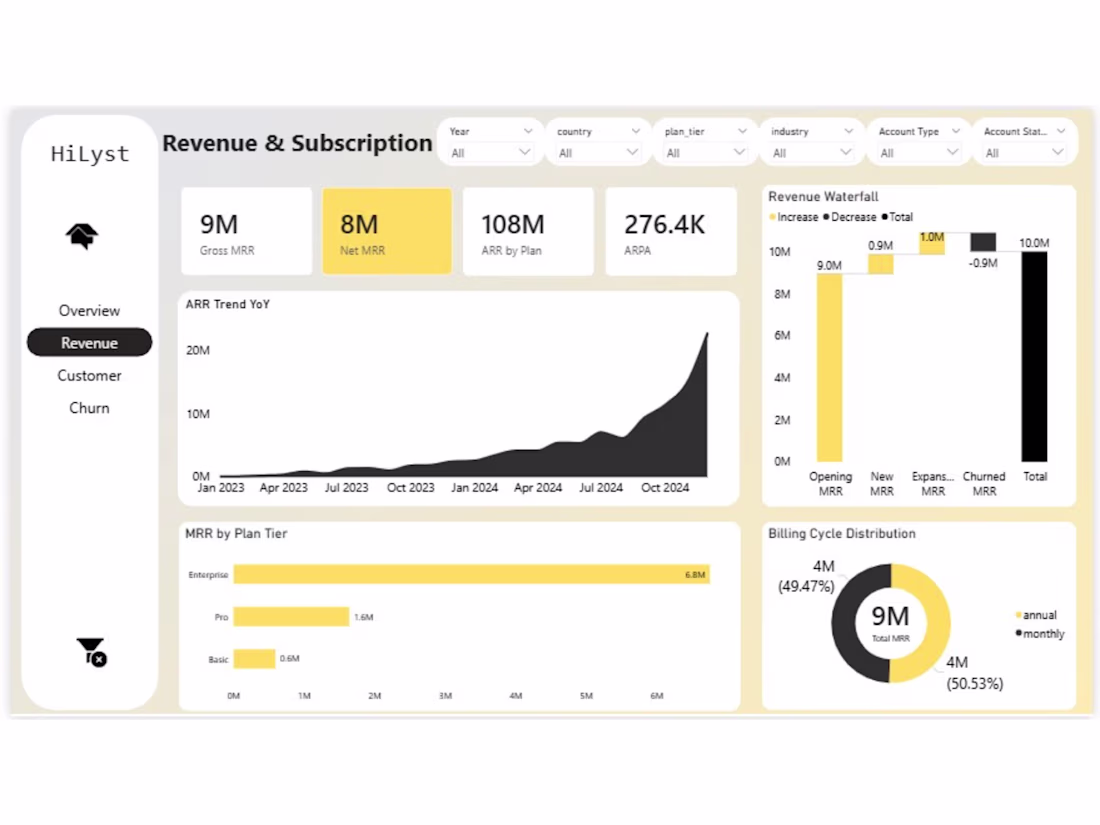
Page 2: Revenue & Subscription Intelligence
Finance-grade revenue quality, billing mix, and predictability.
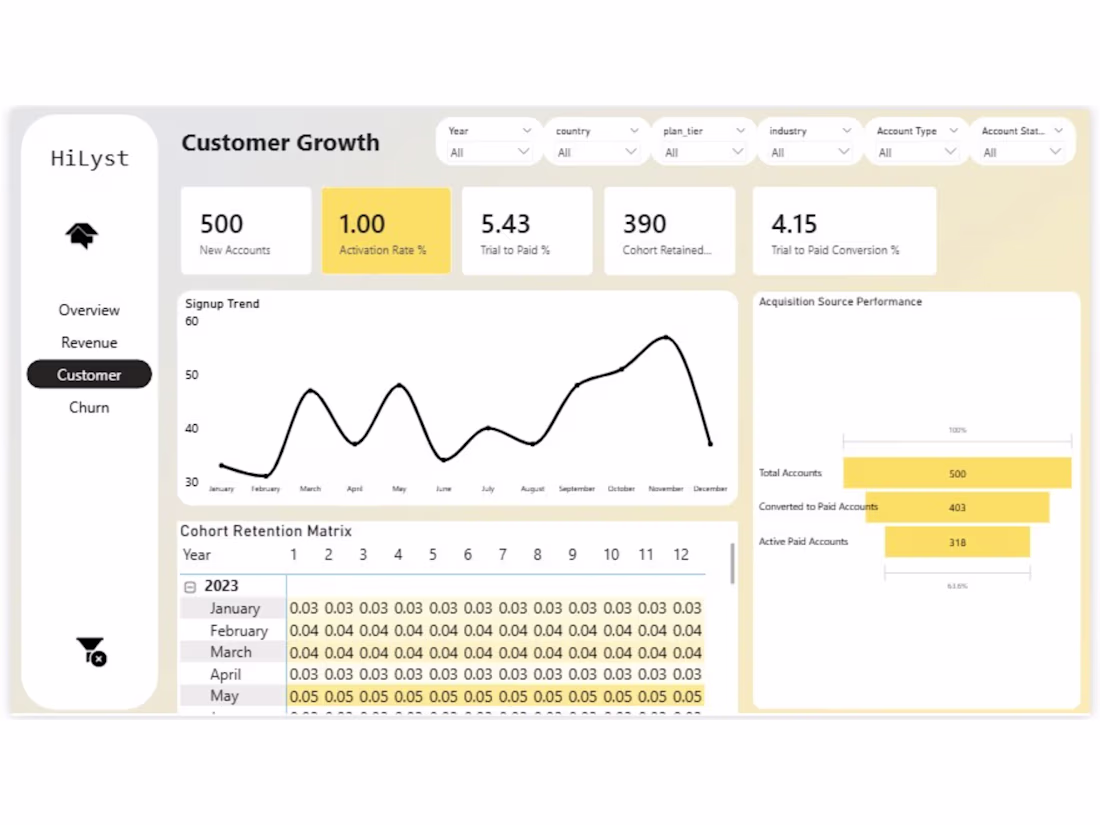
Page 3: Customer Growth & Cohort Analysis
Growth efficiency and long-term value assessment.
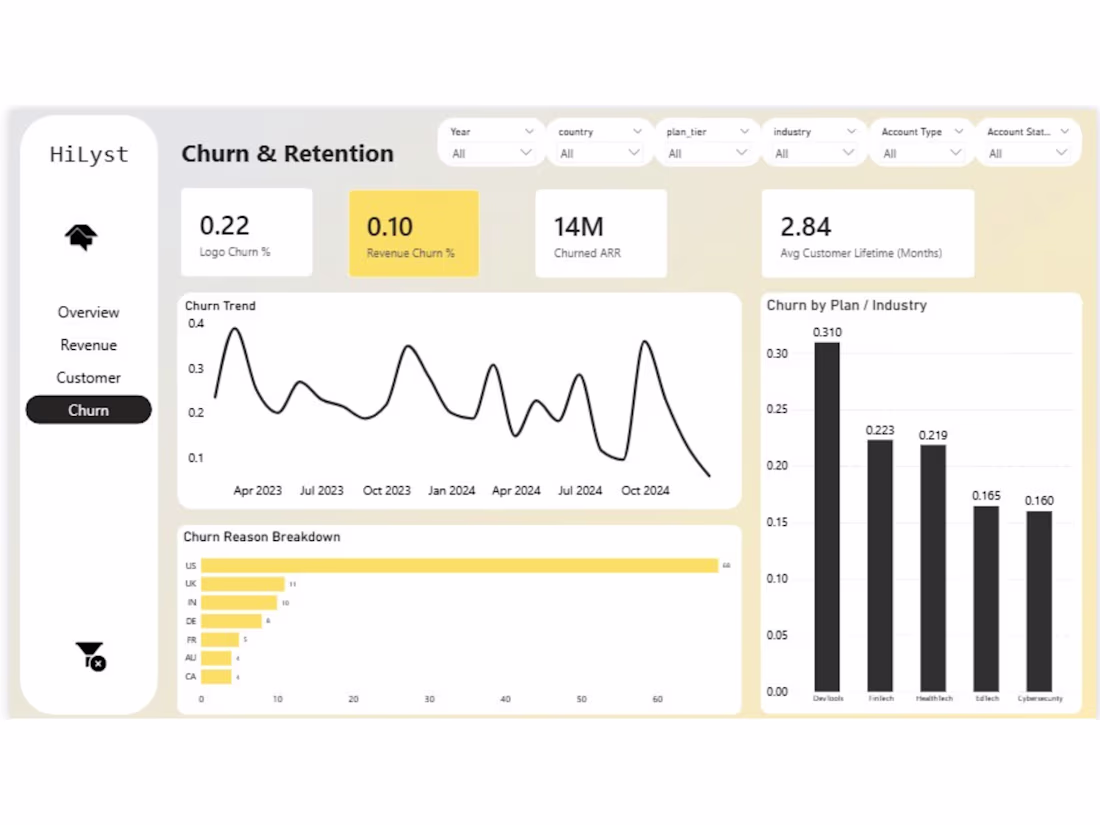
Page 4: Churn & Retention Intelligence
Root-cause analysis for customer and revenue loss.
Outcome: Each page answers a clear business question.
8. Validation, Governance & Quality Control
Risk Solved: Loss of trust in numbers
Reconciled KPIs across pages
Identified mismatches and weak metrics
Highlighted where data limits interpretation
Outcome: Transparent, auditable analytics.
9. Deployment, Access & Enablement
Risk Solved: Analytics unused after delivery
Designed for:
Executive consumption
Finance review
Growth and retention teams
Clear filtering logic and drill paths
Outcome: Analytics integrated into decision workflows.
10. Business Adoption & Continuous Improvement
Risk Solved: One-time dashboard projects
Metrics designed to evolve with better data
Structure supports future enrichment:
Sales data
Marketing attribution
Product telemetry
Outcome: Long-term analytics asset, not a static report.
Fortune 500 Readiness Assessment (Honest)
Design maturity: High
Business framing: Strong
Analytical rigor: Medium (data-limited, transparently flagged)
Production readiness: Requires tighter metric reconciliation
This project is not presented as production finance reporting. It is positioned correctly as a Revenue & Growth Intelligence Framework.
Why This Project Matters
Most dashboards answer:
“What happened?”
This system answers:
“Why it happened, where risk exists, and what breaks next if nothing changes.”
That is the difference between reporting and analytics leadership.
Author
Himansh Upadhyay Analytics | Business Intelligence | Decision Systems
This project reflects an analytics mindset focused on profitability, risk reduction, and executive decision-making, not tool usage.
The network for creativity
Join 1.25M professional creatives like you
Connect with clients, get discovered, and run your business 100% commission-free
Creatives on Contra have earned over $150M and we are just getting started
Related posts
Building a brand new AI Fintech dashboard components
WIP :)
Cool
In this concept, we focused on simplifying project and task management through a cleaner dashboard experience. Caliber combines kanban organization, list views, progress tracking, team collaboration, and quick task actions into one structured workspace. With minimal layouts, soft visual hierarchy, and intuitive interactions, managing complex workflows feels faster, lighter, and easier to navigate for modern SaaS teams.
📩 Collaborate with Us? Contra Cansaas Agency
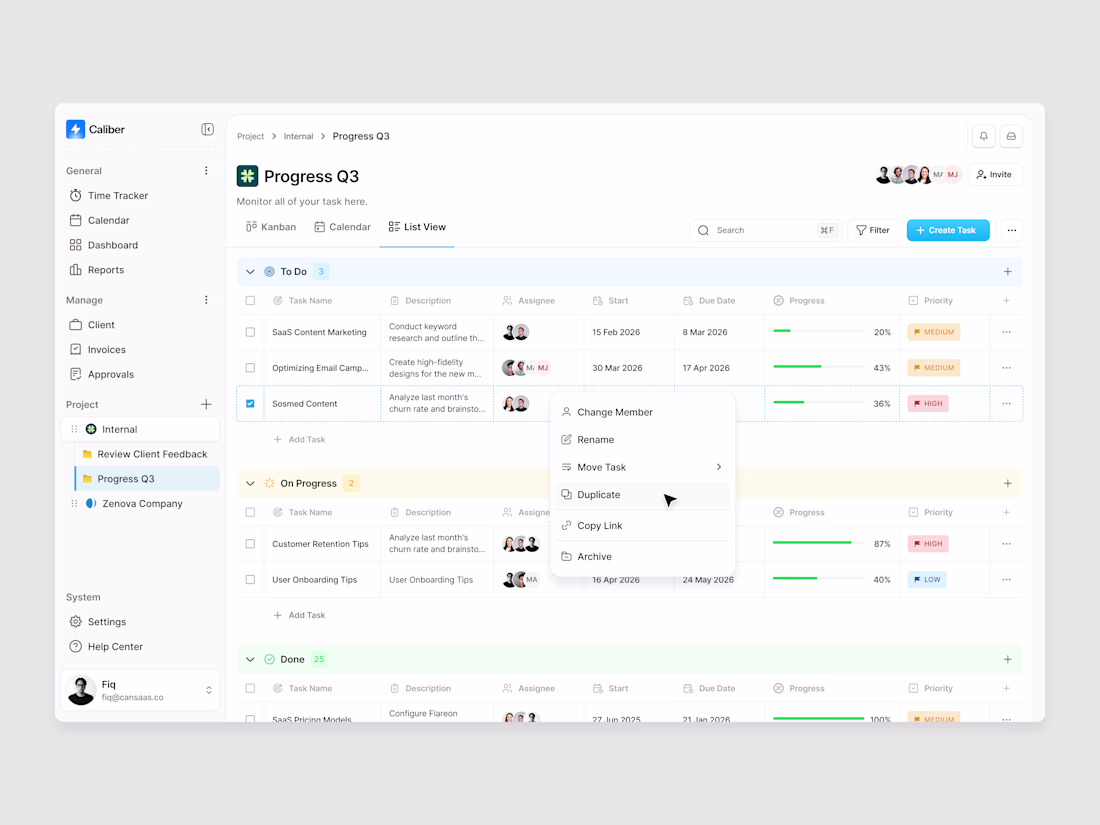
This design gives a polished product feel right away 🚀
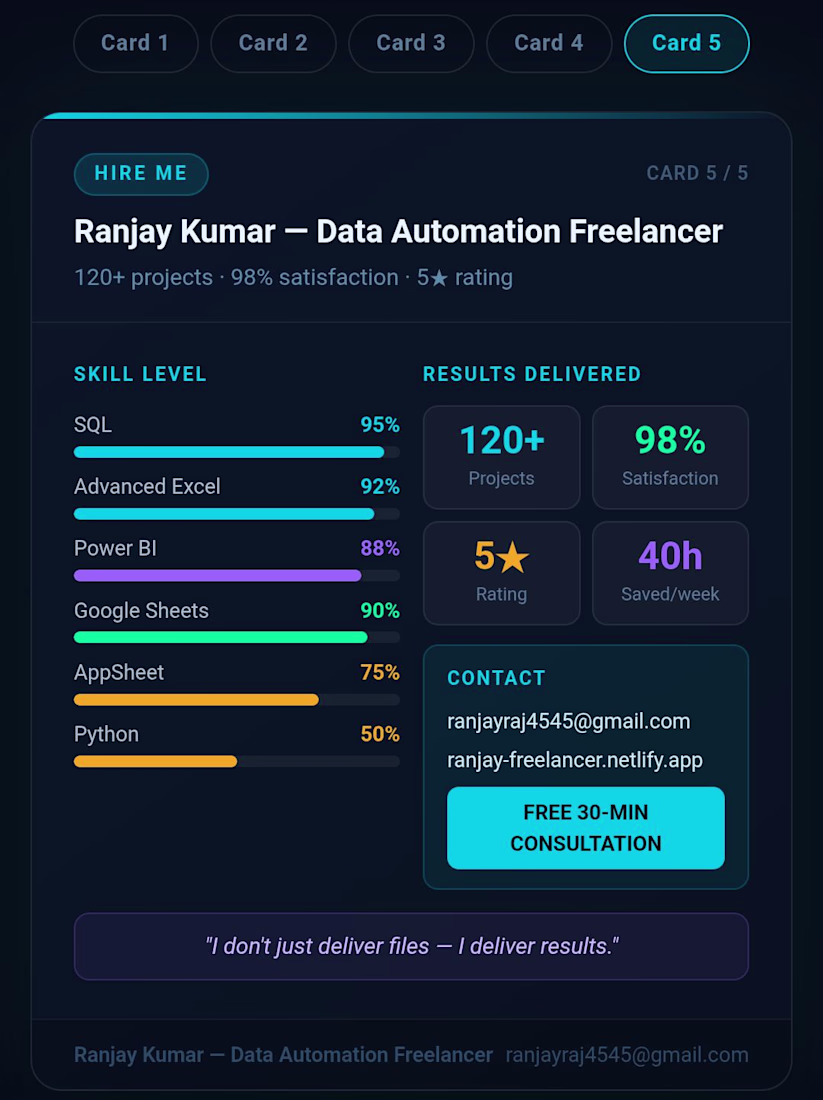
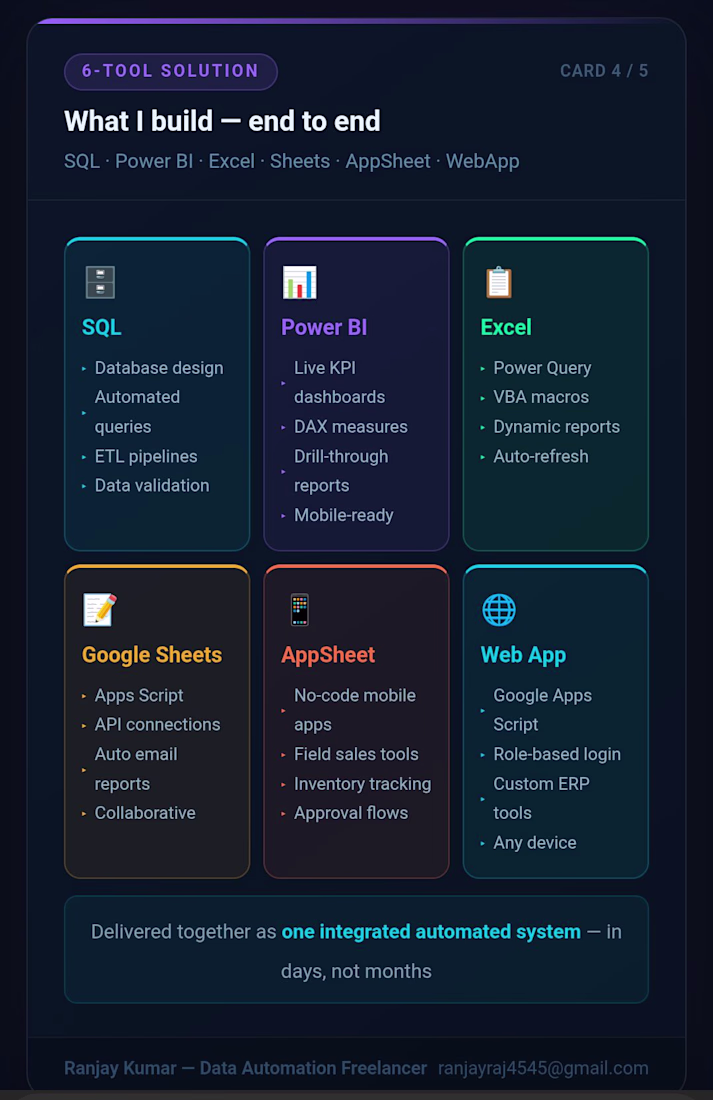
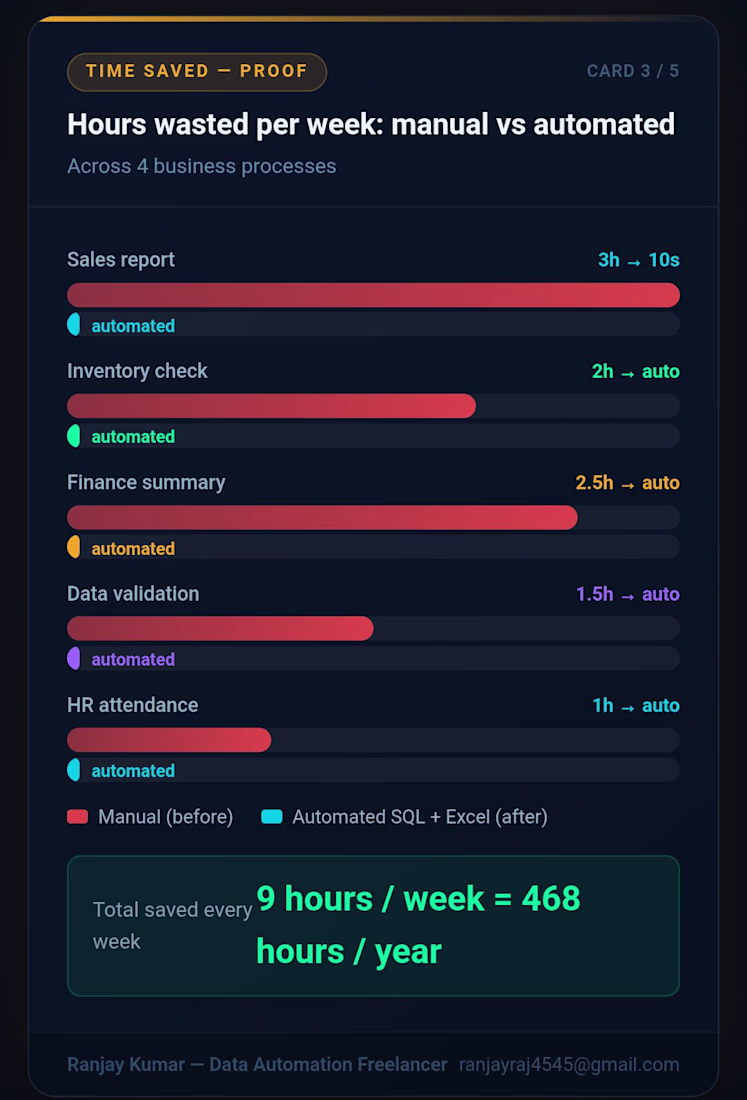
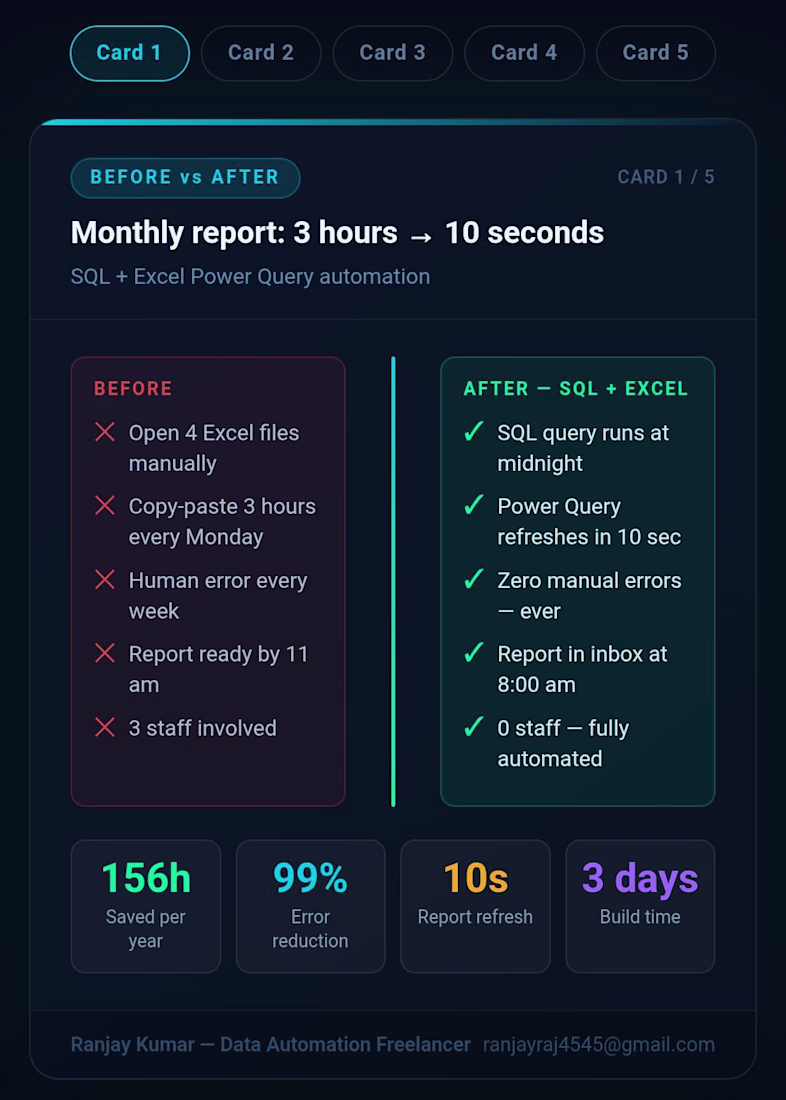
I automated a business workflow using SQL + Excel by connecting multiple Excel files into one system, creating automated data refreshes, building a live dashboard, and scheduling automatic reports — eliminating manual work and saving hours every week.
Trending
Claude
Claude has entered the design space. How are you using Claude Design?
Contra University
Learn from expert creatives how to earn more using next-gen AI tools.
creativeaiflow
Creative AI workflows are evolving. What tools do you use, and what are their strengths and weaknesses?
portfolioreview
The best portfolios tell a story, not just show a grid. Share yours for feedback.
freelancerlife
Freelancer life is wins, pivots, and everything in between. What’s yours right now?