The network for creativity
Join 1.25M professional creatives like you
Connect with clients, get discovered, and run your business 100% commission-free
Creatives on Contra have earned over $150M and we are just getting started
Back to feedPost

Here is a draft tailored specifically to this Sales and Profit Dynamic Excel Dashboard:
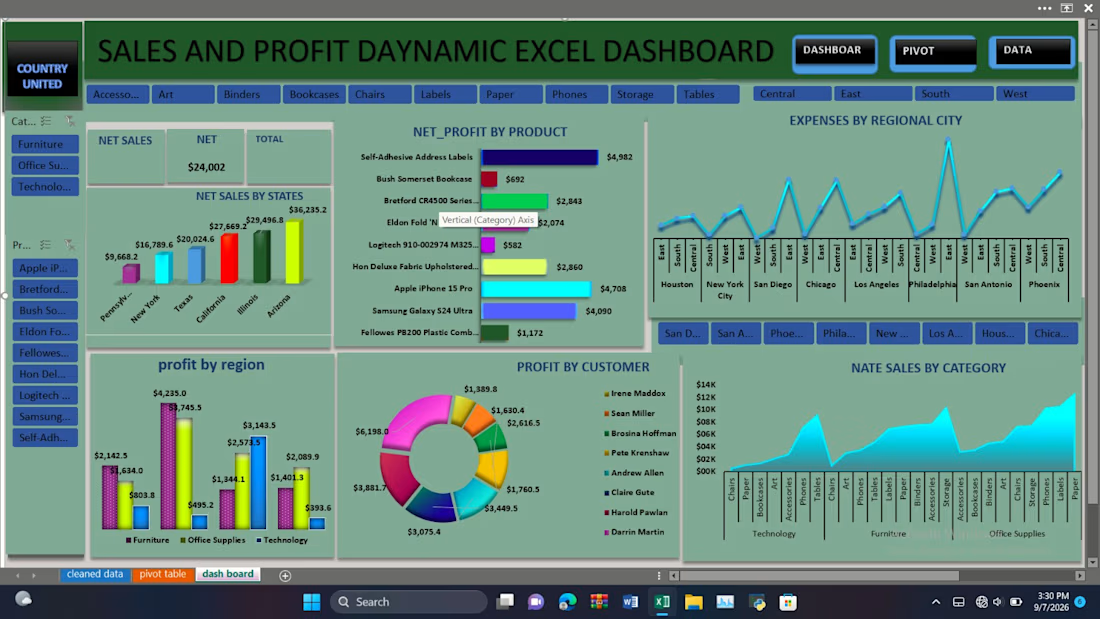
Sales & Profit Dynamic Excel Dashboard
An interactive, data-driven Excel dashboard designed to track profitability, net sales performance, and operational expenses across product categories, customer segments, and geographic regions.
Key Features & Insights:
• Geographic & Regional Analysis: Tracks net sales across major states and tracks expenses broken down by regional cities.
•
• Product Profitability: Highlights net profit generated across key products (such as phones, labels, and office items) and evaluates sales performance across primary product categories (Furniture, Office Supplies, Technology).
•
• Regional & Customer Insights: Features a regional profit breakdown alongside a customer profitability breakdown.
•
• Dynamic Interactivity: Built using automated Pivot Tables, dynamic data connections, and multi-parameter slicers (Country, Sub-Category, Region) for customizable data filtering.

The network for creativity
Join 1.25M professional creatives like you
Connect with clients, get discovered, and run your business 100% commission-free
Creatives on Contra have earned over $150M and we are just getting started




Related posts

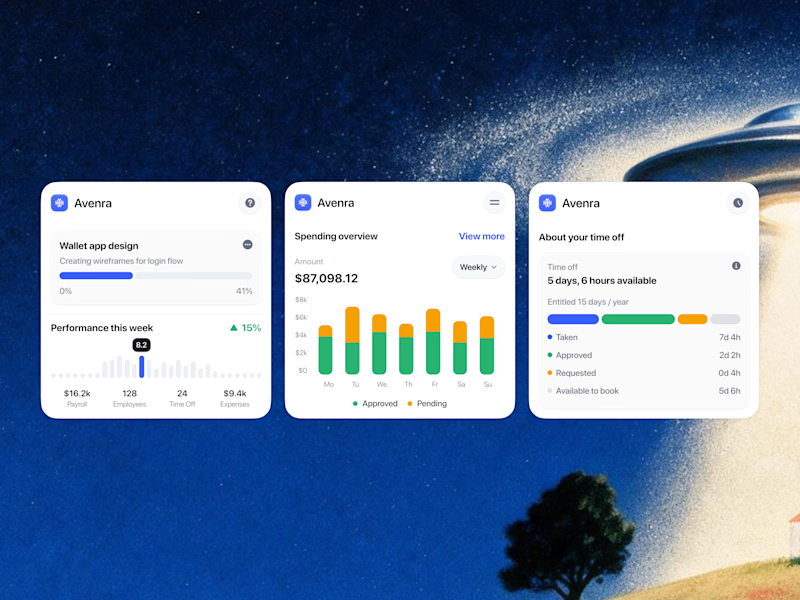
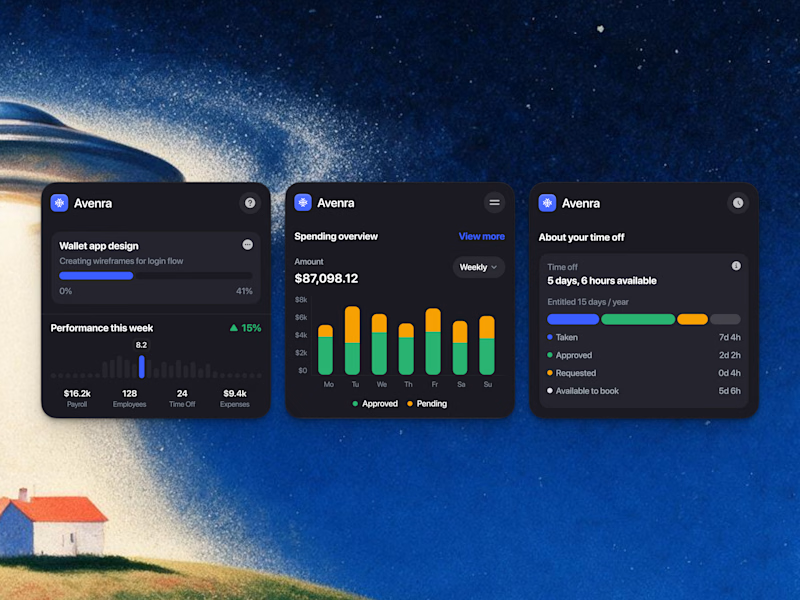
Which style wins for you? 🤔
We’re testing out two theme directions for Avenra’s dashboard component cards; featuring real-time spending breakdowns, project progress metrics, and time-off tracking.
Curious to hear your thoughts! 💬

8 voted
42%
11 voted
58%
19 votes
Closed

Energy communities need to manage a lot at once: consumption, generation, members, billing, reports, alerts, and operational changes.
Wattbank explores a clearer SaaS dashboard experience for energy community operators. The interface brings key metrics, energy balancing, participant distribution, billing, reporting, and insights into one workspace that is easy to scan and act on.
The goal was to move away from heavy energy software and create something more visual, human, and operationally useful.

Dashboard Key Highlights:
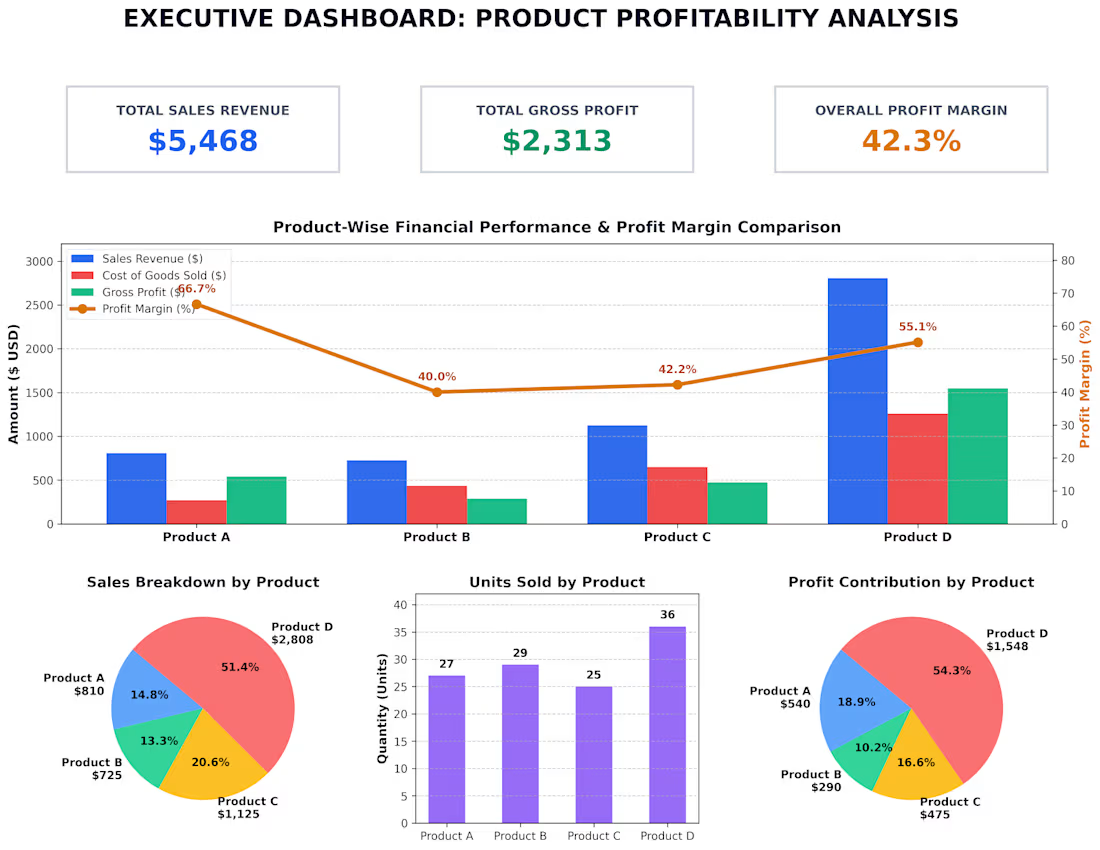
Total Performance: Total Revenue of $5,468 and Gross Profit of $2,313 with an overall profit margin of 42.3%.
Top Profit Contributor: Product D yields the highest gross profit at $1,548 (54.3% of total profit) and revenue of $2,808 (51.4% of total sales).
Highest Margin Product: Product A leads in efficiency with a 66.7% profit margin ($540 profit on $810 sales).