The network for creativity
Join 1.25M professional creatives like you
Connect with clients, get discovered, and run your business 100% commission-free
Creatives on Contra have earned over $150M and we are just getting started
Back to feedPost

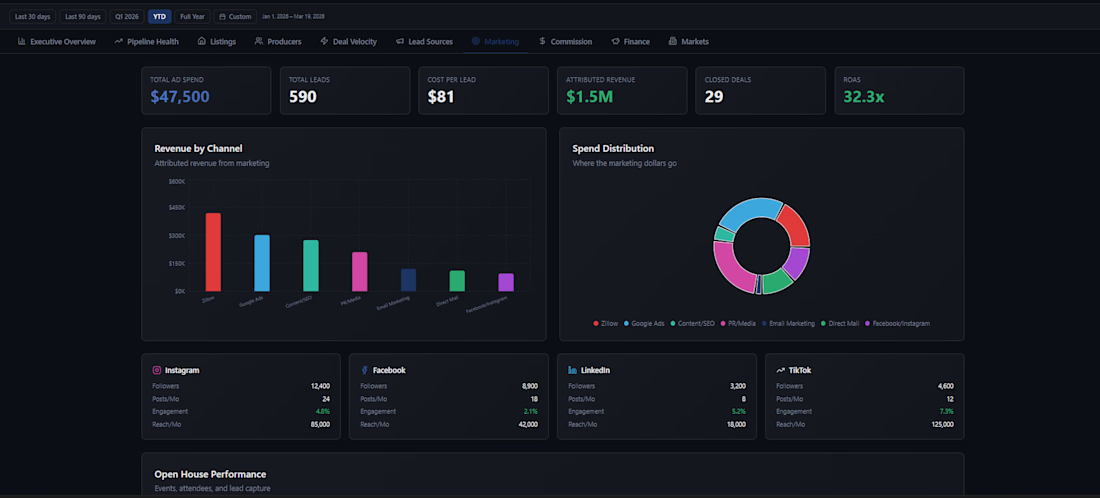
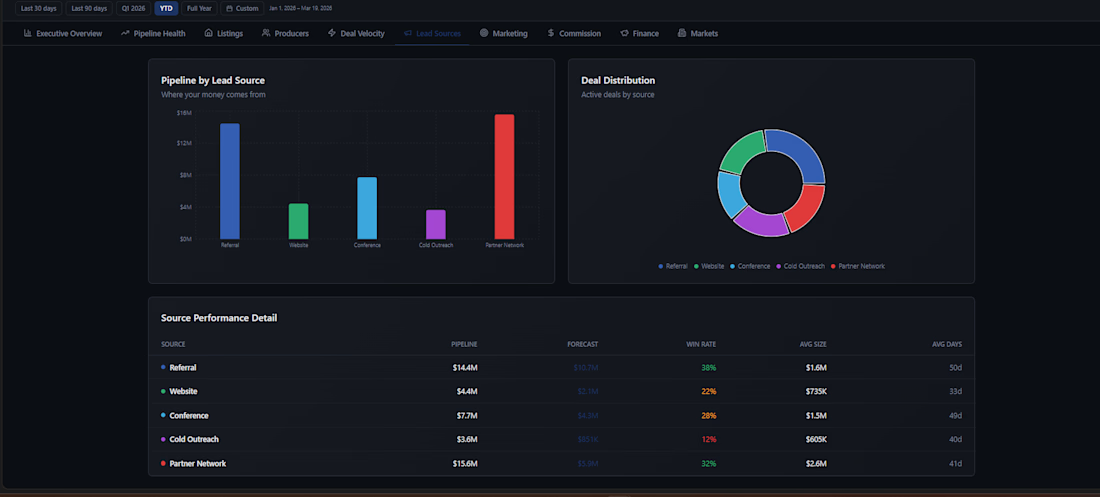
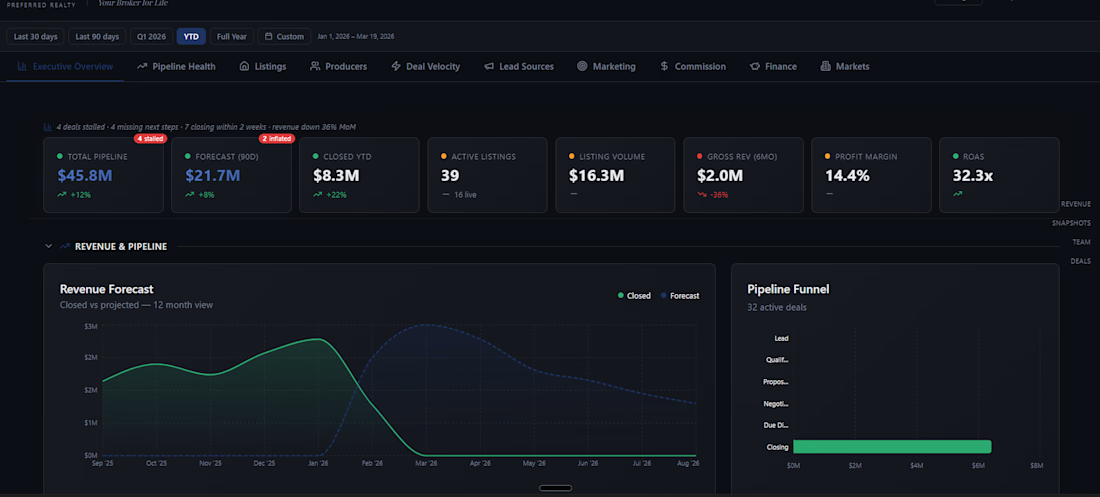
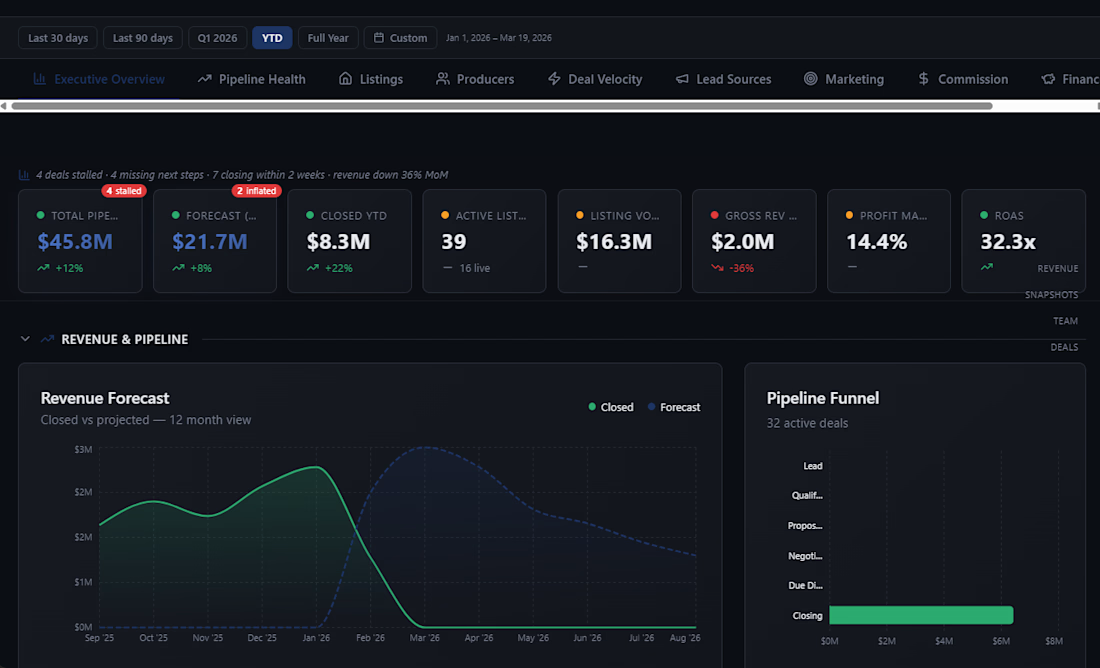
One dashboard. Every metric that matters, pipeline, agents, commissions, marketing ROI, and P&L, updated live and color-coded so problems jump off the screen.
No more stitching spreadsheets before Monday meetings. Know which deals are stuck, who's crushing quota, and where your next dollar's coming from, in seconds.
Built for managing brokers and brokerage owners who'd rather lead than dig through data.
Ready to see your numbers this clearly?


The network for creativity
Join 1.25M professional creatives like you
Connect with clients, get discovered, and run your business 100% commission-free
Creatives on Contra have earned over $150M and we are just getting started




Related posts

Designed the website for Dovora — an agency that builds businesses for creators, not brand deals. "We don't represent brands, we don't split focus" is basically the whole pitch, and I wanted the site to feel just as uncompromising.
So no polished stock creator-economy visuals. The hero is a wall of real streamer/podcast footage arranged in overlapping diamonds and rounded frames — actual creators, mid-stream, mid-laugh — with a glowing gradient orb behind bold "WE BUILD CREATOR BUSINESSES" type. It reads more like a highlight reel than a landing page, which felt right for an audience that lives on camera.
The second section flips the energy completely — dark, minimal, almost aggressive typography ("BUILT EXCLUSIVELY FOR CREATORS. FULL STOP.") paired with huge chrome-and-neon 3D letterforms spelling out CREATORS. It's loud in a completely different way than the hero, and that contrast is intentional — this isn't a buttoned-up agency deck, it's built for people who make content for a living.
Genuinely fun brief to lean all the way into.


AI-Assisted Sales Intelligence Dashboard
Project Overview
This project is an end-to-end Sales Analytics solution built using Python, SQL, and Power BI.
The workflow includes:
Data Cleaning using Python (Pandas)
Data Storage using SQLite
Business Analysis using SQL Queries
Interactive Dashboard using Power BI
Automated Business Report Generation using Python
The goal of this project is to analyze sales performance, identify profitable products, monitor regional performance, and generate business recommendations.
Dataset
Dataset: Sample Superstore Dataset
Records: 9,994
Features:
Order Details
Customer Information
Product Information
Sales
Profit
Discount
Region
Category
Sub-Category
Tools & Technologies
Python
Pandas
SQLite
SQL
Power BI
Data Visualization
Business Intelligence
Project Workflow
CSV Dataset
↓
Data Cleaning (Python)
↓
SQLite Database
↓
SQL Analysis
↓
Power BI Dashboard
↓
AI Business Report
Dashboard Pages
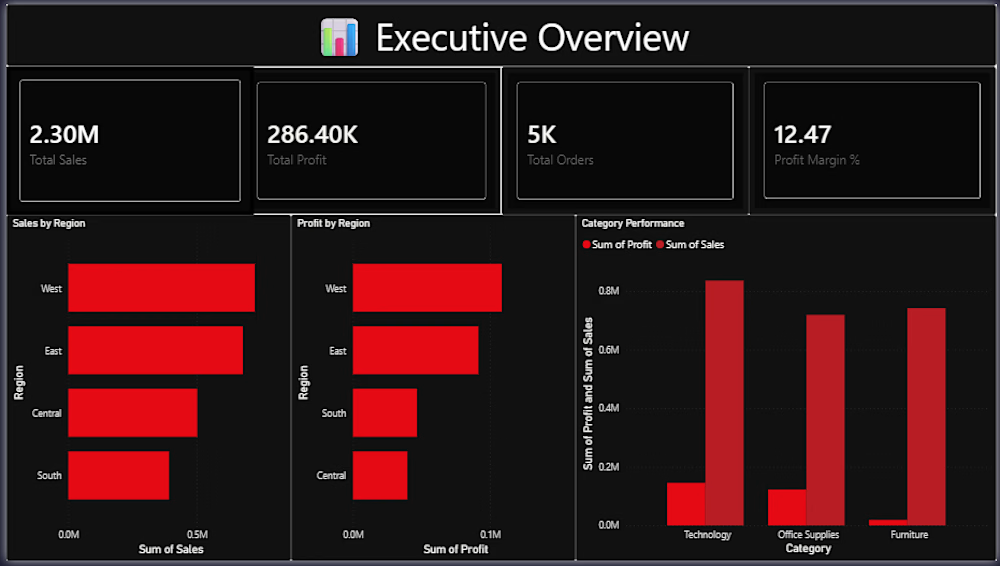
Executive Overview Total Sales Total Profit Total Orders Profit Margin Regional Sales Analysis Category Performance Analysis
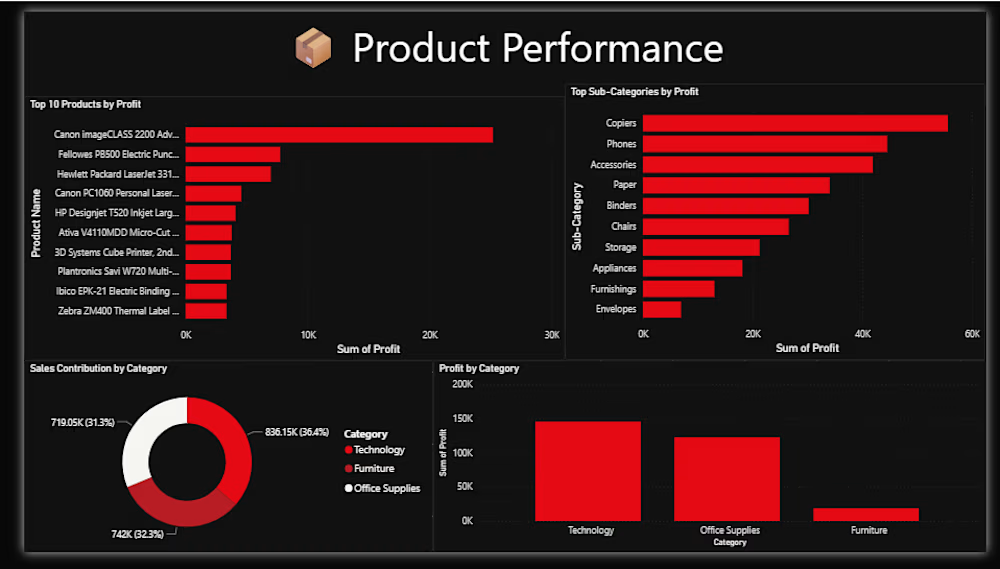
Product Performance Analysis Top Profitable Products Loss-Making Products Profit by Category Sales by Sub-Category
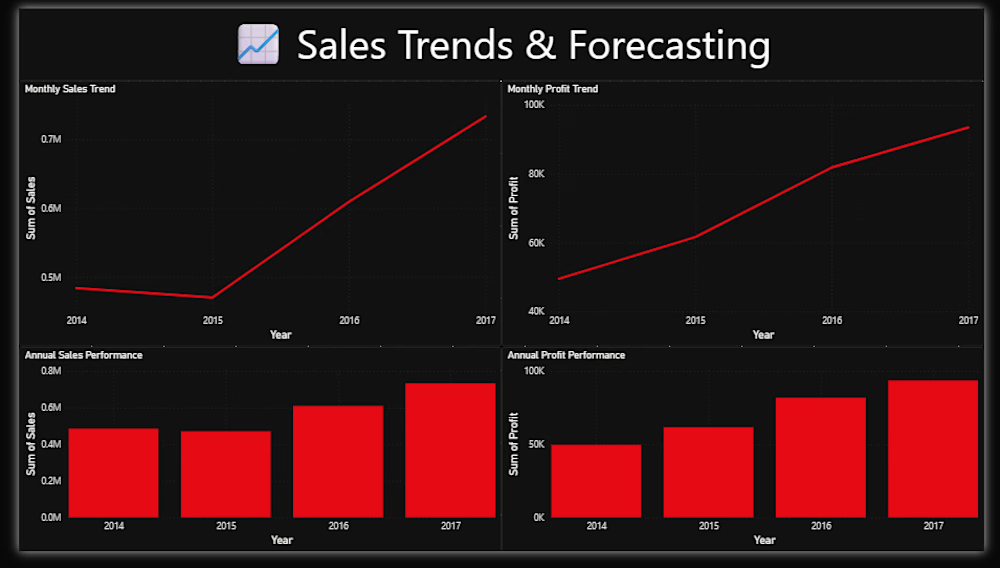
Sales Trends Analysis Sales Trends Over Time Profit Trends Seasonal Performance Insights Key Business Insights West Region generated the highest sales. Technology is the most profitable category. Several products generate significant losses and require pricing review. Sales performance varies significantly across regions. Automated AI Report The project includes a Python-based reporting system that automatically generates:
Total Sales
Total Profit
Business Insights
Strategic Recommendations
Author
Gourav Jangid
Aspiring Data Analyst
Open to Data Analytics Opportunities