The network for creativity
Join 1.25M professional creatives like you
Connect with clients, get discovered, and run your business 100% commission-free
Creatives on Contra have earned over $150M and we are just getting started
Back to feedPost

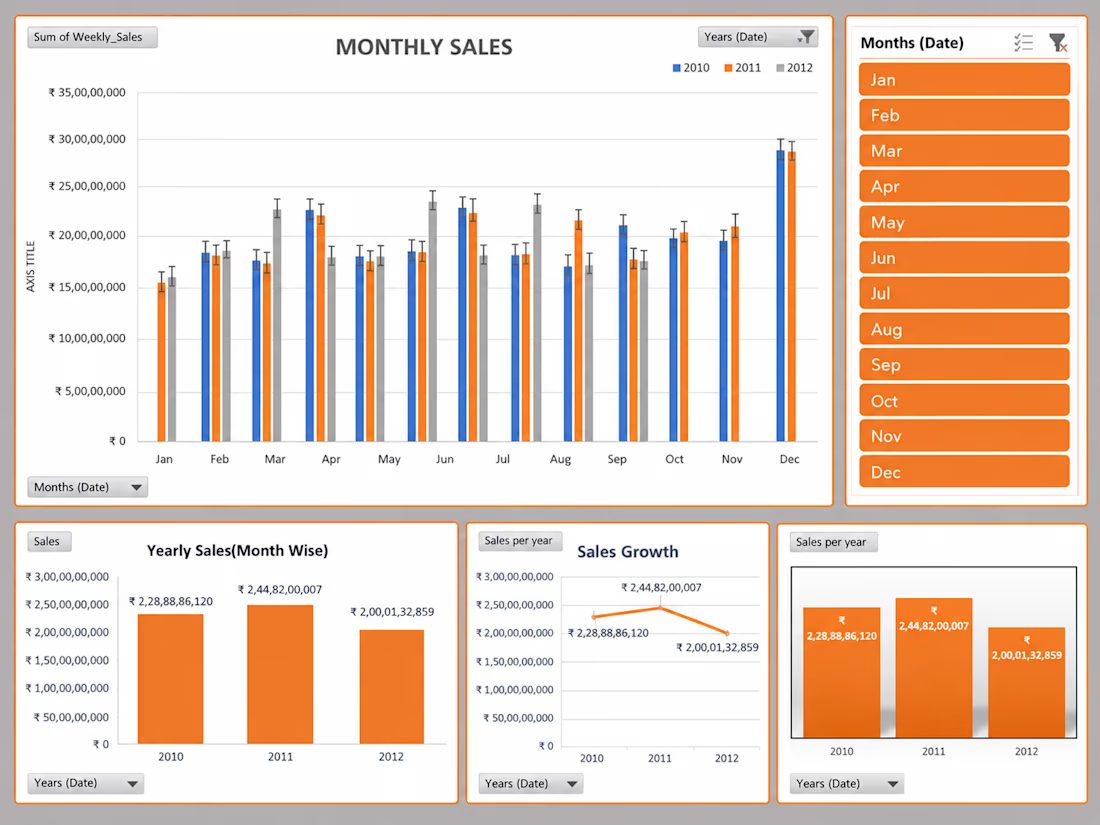
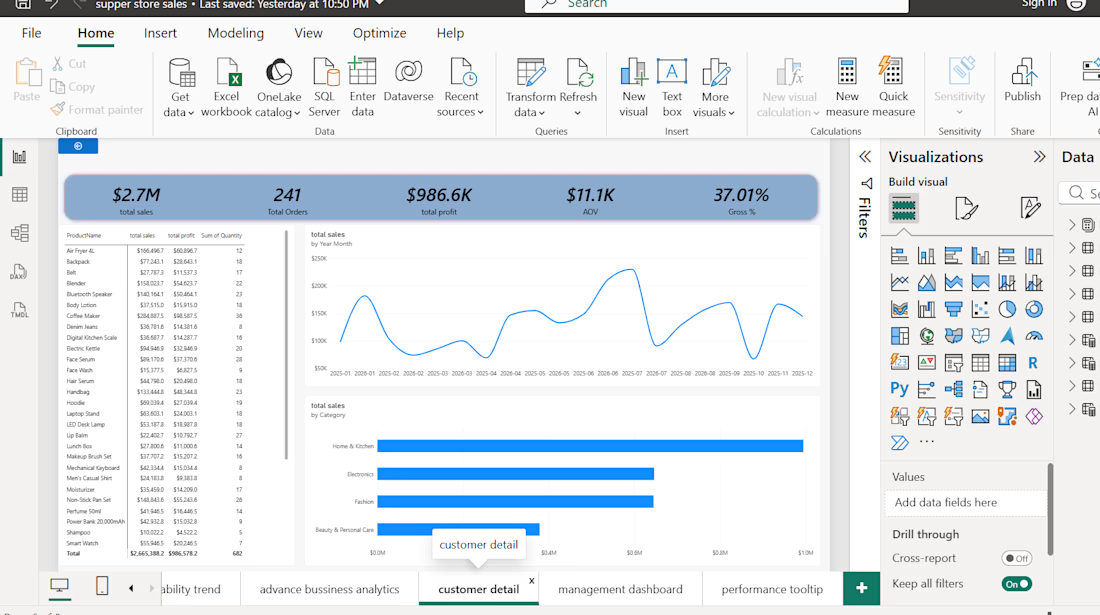
i use power bi in converting raw data into useful meaningful insights

The network for creativity
Join 1.25M professional creatives like you
Connect with clients, get discovered, and run your business 100% commission-free
Creatives on Contra have earned over $150M and we are just getting started

Challenges
View all


Related posts

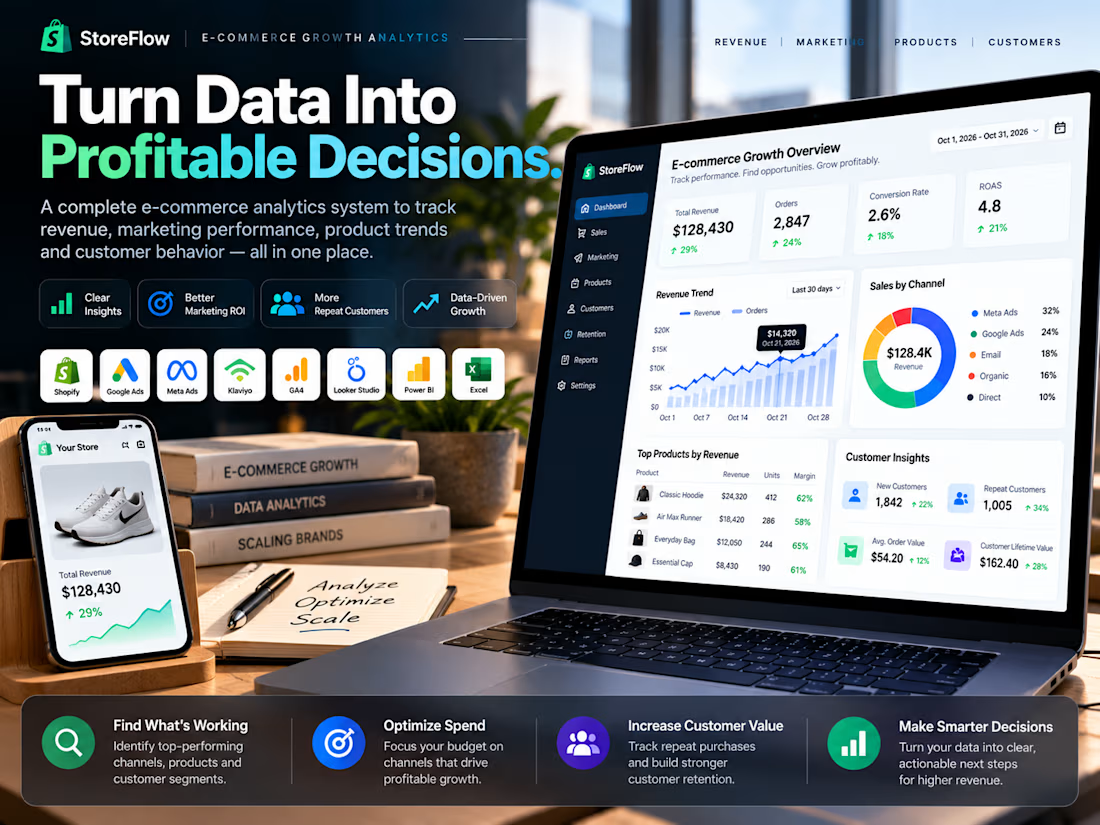
See exactly what’s driving revenue, where growth is leaking, and which products, channels, and customers deserve more investment.
I developed an e-commerce growth intelligence system around one question:
Where should the business invest next?
Most stores already have plenty of data. The harder problem is understanding what that data means for revenue, marketing spend, products, and customer growth.
So instead of building another dashboard full of charts, I’m structuring the system around decisions.
It brings together signals such as revenue, ROAS, CAC, conversion, product performance, repeat purchases, and retention to identify things like:
which channels deserve more budget, where acquisition is becoming inefficient, which products attract traffic but fail to convert, and where repeat customers are creating stronger value.
The goal isn’t just to answer:
“What happened?”
It’s to answer:
“What should we do next?”
Because the most useful analytics system isn’t the one with the most charts.
It’s the one that makes the next business decision clearer.
Tags: E-Commerce · Marketing Analytics · Data Analytics · Power BI · E-commerce Management
Marketing AnalyticsData AnalysisecommerceeCommerce ManagementMicrosoft ExcelMicrosoft Power BIShopify



Exactly. Analytics becomes much more valuable when it helps businesses make smarter decisions, not just track numbers.

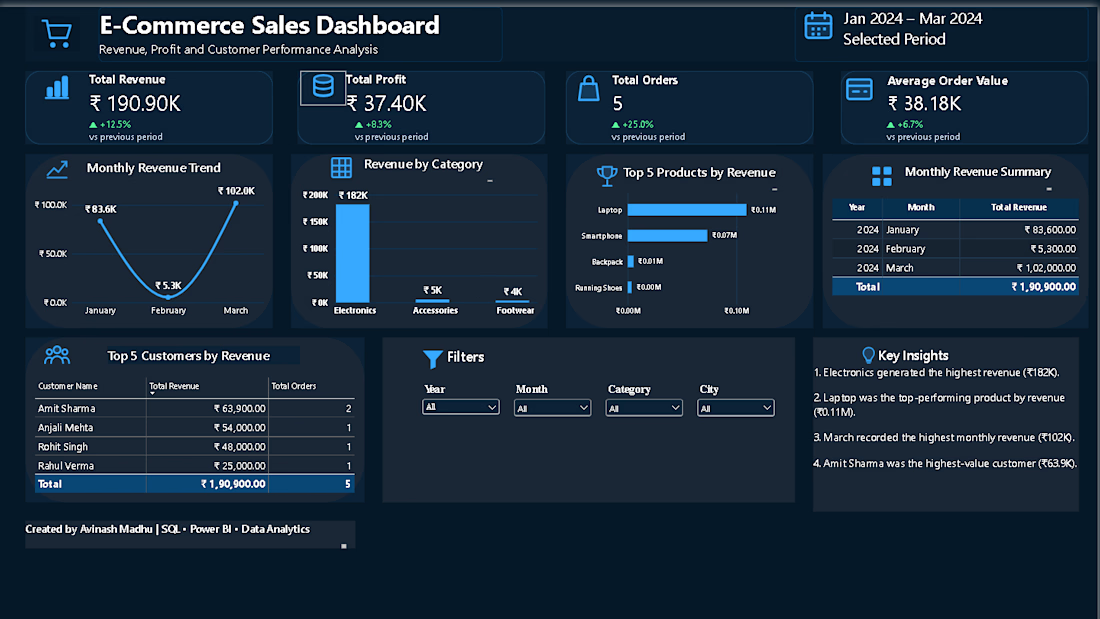
E-Commerce Sales Dashboard | Power BI & SQL
Built an interactive e-commerce sales dashboard using SQL and Power BI to analyze revenue, profit, orders, product performance, customer performance, and monthly sales trends.
Key features:
Revenue and profit KPI tracking
Monthly revenue trend analysis
Category and product performance
Top customer analysis
Interactive Year, Month, Category, and City filters
Revenue summary and business insights Tools: SQL, Power BI, Data Analysis, Data Visualization


📊 Turning Data Into Insights
Sharing one of my recent Power BI dashboard projects.
I worked on transforming raw data into an interactive dashboard with a focus on:
• Data cleaning & transformation
• KPI tracking
• Interactive visualizations
• DAX calculations
• Trend & performance analysis
🛠️ Tools: Power BI • Power Query • DAX • Excel
Still learning, building, and improving with every project. 🚀
#PowerBI #DataAnalytics #DataVisualization #DAX #BusinessIntelligence #DataAnalyst #Analytics #Dashboard