The network for creativity
Join 1.25M professional creatives like you
Connect with clients, get discovered, and run your business 100% commission-free
Creatives on Contra have earned over $150M and we are just getting started
Back to feedPost

: Healthcare Revenue Cycle Analytics Dashboard | Power BI
Project Description
Developed an interactive Power BI dashboard to analyze healthcare Revenue Cycle Management (RCM) performance using claims and financial data. The dashboard provides a centralized view of key performance indicators, helping stakeholders monitor revenue, collections, denials, payer performance, and accounts receivable (AR) aging.
The solution includes dynamic filters, KPI cards, trend analysis, and interactive visualizations that make it easy to explore data and identify operational insights. The dashboard was designed to support data-driven decision-making and improve reporting efficiency.
Key Features:
Interactive KPI Dashboard
Revenue & Collection Analysis
Billed vs Paid Performance
Denial & Claims Analysis
AR Aging Distribution
Monthly Revenue Trends
Payer Performance Analysis
Dynamic Filters & Drill-down Reporting
Tools & Technologies: Power BI, DAX, Power Query, Microsoft Excel


The network for creativity
Join 1.25M professional creatives like you
Connect with clients, get discovered, and run your business 100% commission-free
Creatives on Contra have earned over $150M and we are just getting started
Related posts

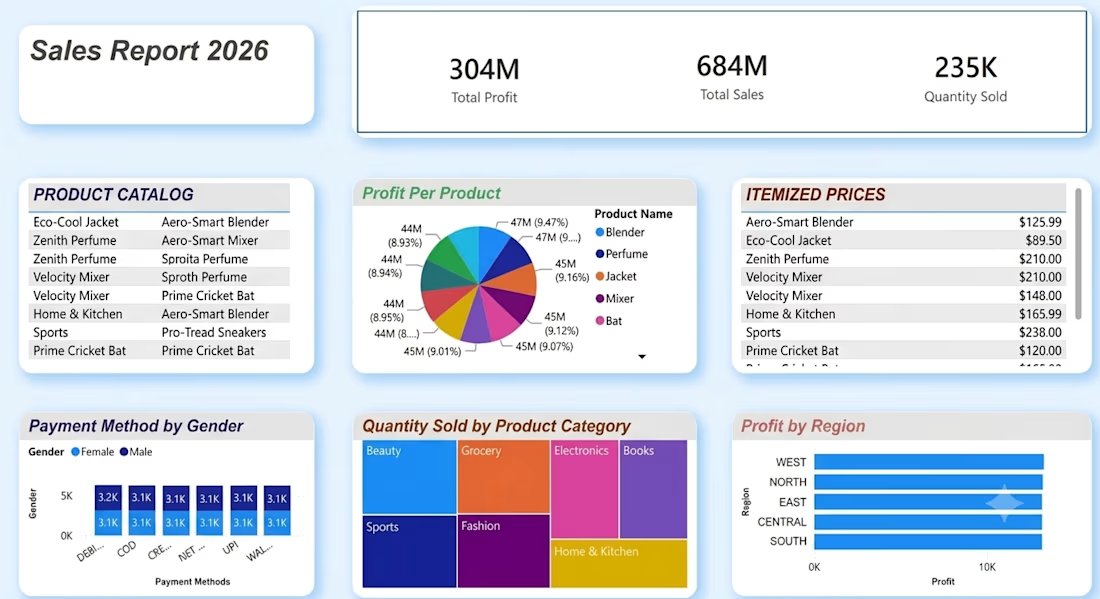
In this project, I developed an insightful dashboard using Power BI, meticulously analyzing a substantial Excel workbook containing 50,000 rows of data. This comprehensive analysis enabled the business to visualize key metrics and trends, ultimately empowering decision-makers to drive informed strategies and optimize performance. The dashboard serves as a vital tool, transforming complex data into actionable insights that facilitate better business outcomes. Through this project, I demonstrated my ability to leverage data analytics to support strategic initiatives and enhance operational efficiency.


Hi I'm interested in this opportunity

Project Title: Seita Financial Management System: M-Pesa Ledger Automation
Project Overview:
Designed and developed a local web-based financial intelligence application tailored for automated mobile money transaction tracking and ledger analysis.
The Problem:
Raw financial statements (like M-Pesa exports) are heavily unorganized, unstructured, and tedious to process manually. Small businesses and individuals waste valuable hours trying to categorize transactions and balance their ledgers.
The Solution:
Built an interactive portal that ingests messy statement uploads (.xlsx / .csv) and instantly runs automated ledger classification. The system cleans raw text inputs, handles transaction types seamlessly, and outputs client-ready structured data for instant financial reporting.










Trending

Claude
Claude has entered the design space. How are you using Claude Design?

Contra University
Learn from expert creatives how to earn more using next-gen AI tools.
fifaworldcup2026
The World Cup is here and the whole world's watching. How are you designing for the world stage?
creativeaiflow
Creative AI workflows are evolving. What tools do you use, and what are their strengths and weaknesses?
freelancerlife
Freelancer life is wins, pivots, and everything in between. What’s yours right now?