The network for creativity
Join 1.25M professional creatives like you
Connect with clients, get discovered, and run your business 100% commission-free
Creatives on Contra have earned over $150M and we are just getting started
Back to feedPost

Most dashboards show numbers. Very few explain them.
When signups drop, someone still has to dig through the data and ask “why?”. I wanted the chart itself to do that part.
Ask chart takes a question in plain words, writes the query, picks the right chart, and leads with the answer: “Signups fell 39% after Tuesday, the day the new pricing page went live.” A follow-up like “split by plan” reshapes the same chart instead of starting over.
Details I cared about:
- The headline is a sentence, not a title. The number comes with its reason.
- Hover follows the cursor across days, so you can feel where the drop starts.
- Switching between line, bars, dots and stacked keeps the data in place, so the eye never loses the thread.
- Every answer shows the query it ran, so nothing is a black box.
Built in React with shadcn and Motion. Part of Detent, my library of interface pieces for AI.

The network for creativity
Join 1.25M professional creatives like you
Connect with clients, get discovered, and run your business 100% commission-free
Creatives on Contra have earned over $150M and we are just getting started



Related posts

AI Telemetry & Evaluation Widgets 🟢
What if AI infrastructure data felt calm instead of overwhelming? 🌿
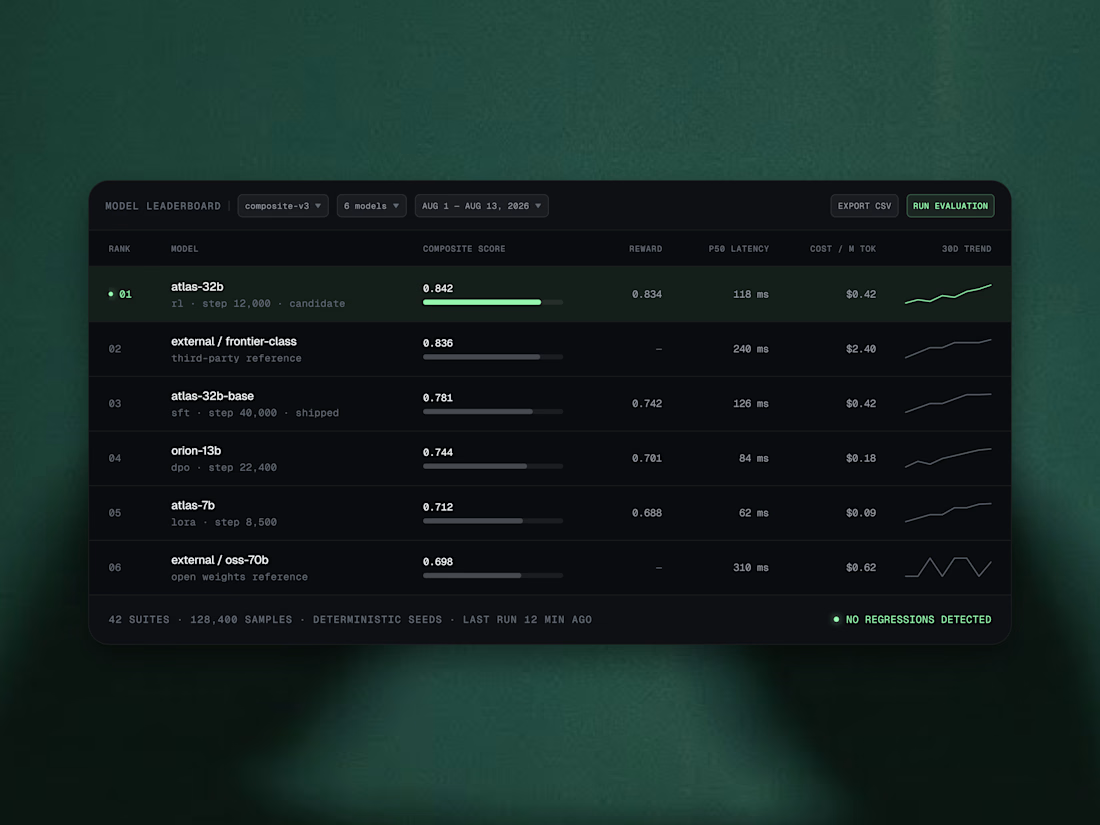
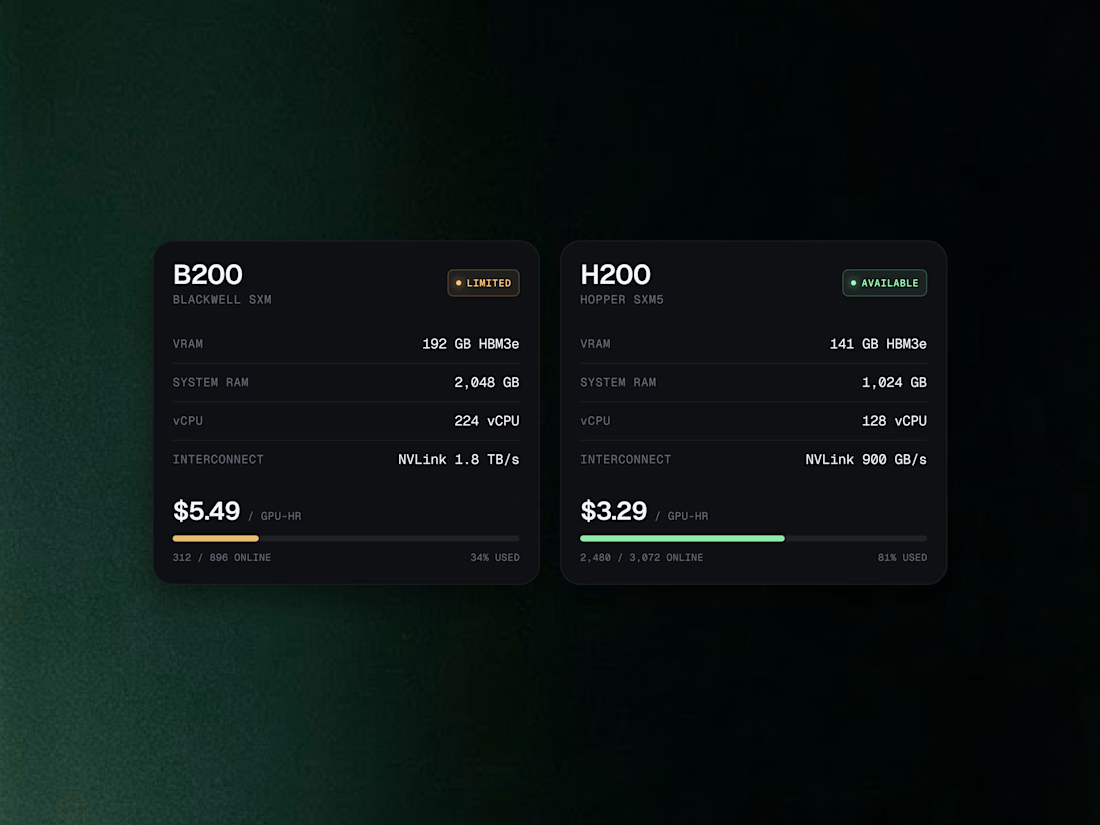
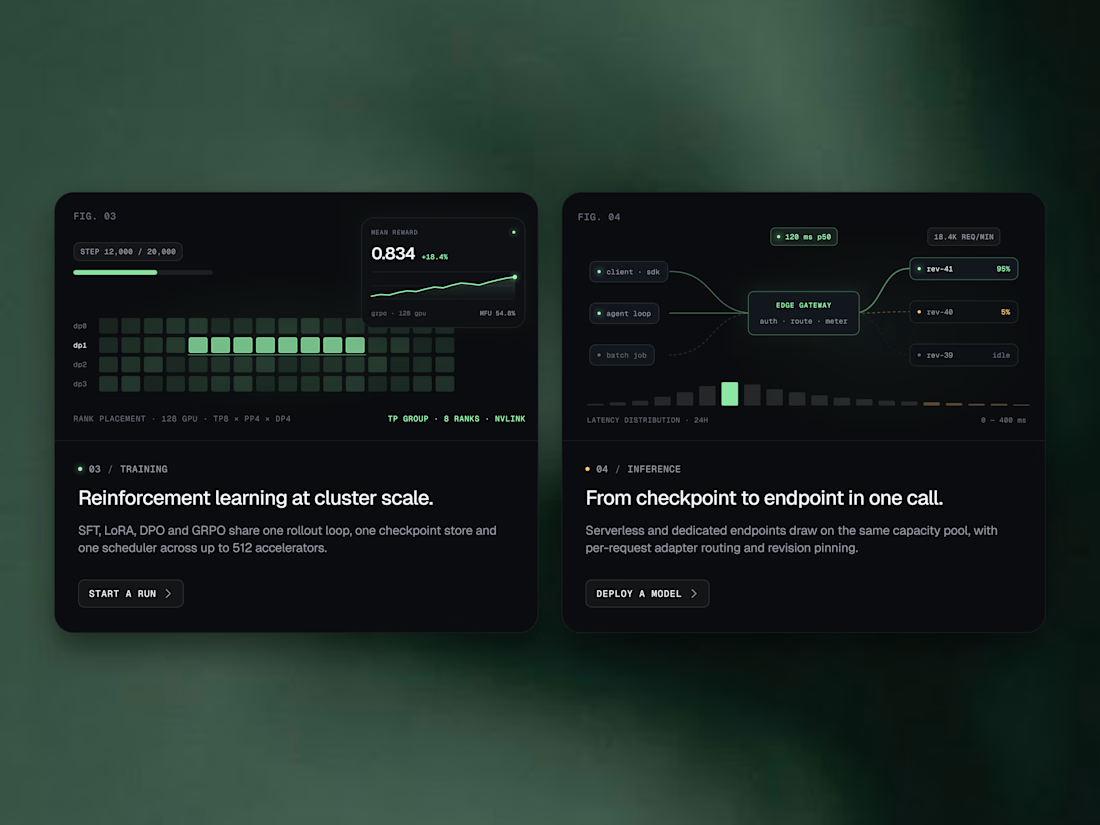
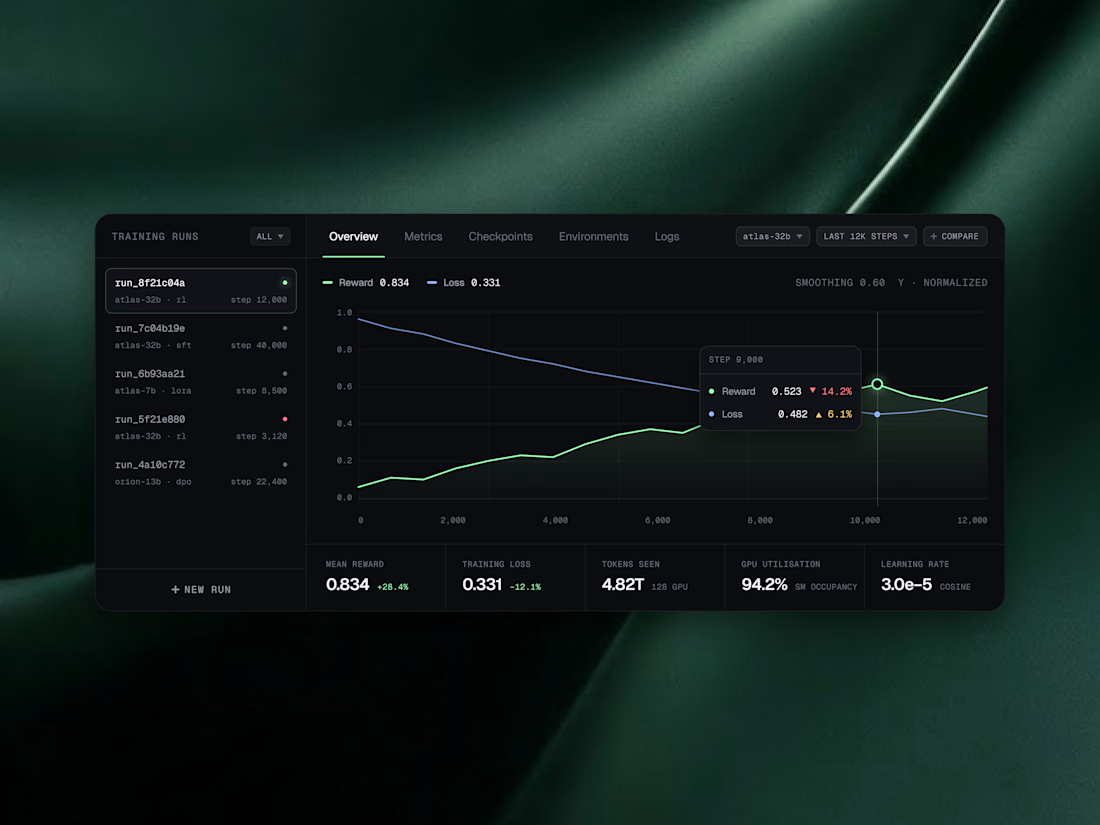
We designed a set of widgets for tracking models, GPUs, and training runs, where every score, price, and metric is easy to scan. Sleek dark cards with soft green highlights float over a rich emerald silk backdrop, turning dense telemetry into something you actually want to look at.
Swipe through the 4 frames to see the model leaderboard, GPU pricing cards, training and inference flows, and live training run charts. 👀
Which widget would you want on your dashboard first? Tell us in the comments! 💬👇
#UIDesign #UXDesign #DashboardDesign #DataVisualization #AIDesign #SaaSDesign #DarkModeUI #DeveloperTools



Nice work


So interactive

Some details from my latest redesigns project
🔗 codex.io


The dark screens look sharp, and the product data stays easy to read. The redesign feels focused on the people using it, not just on a new look.