The network for creativity
Join 1.25M professional creatives like you
Connect with clients, get discovered, and run your business 100% commission-free
Creatives on Contra have earned over $150M and we are just getting started
Back to feedPost
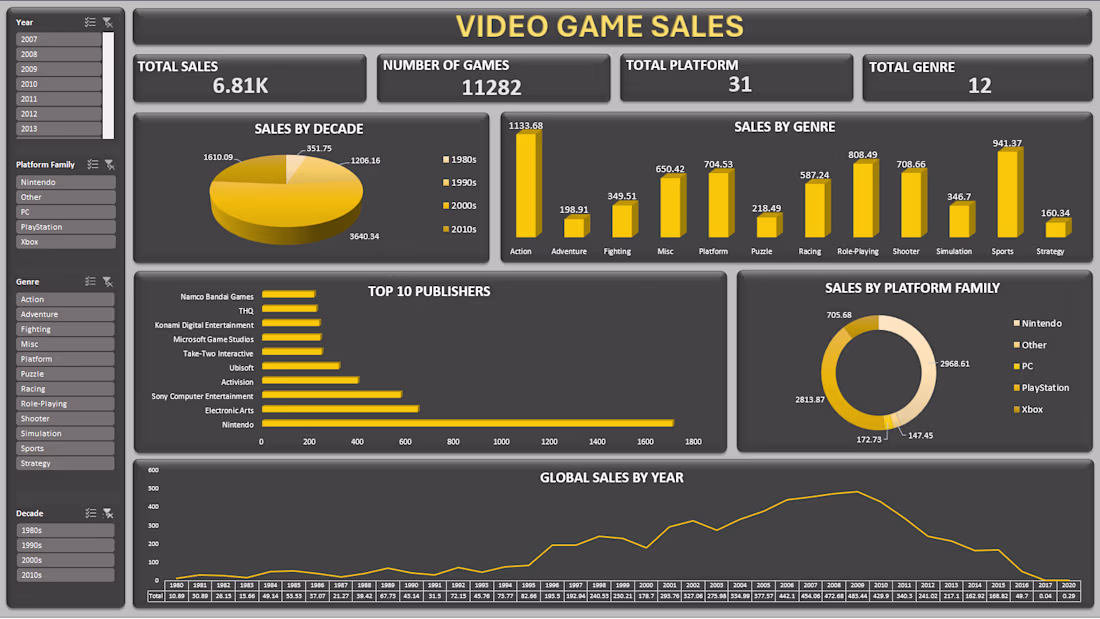
Built an interactive Excel dashboard to analyze global video game sales trends across platforms, genres, publishers, and decades.
This project focused on transforming raw sales data into meaningful business insights using data cleaning, aggregation, and visualization techniques.
Key Highlights:
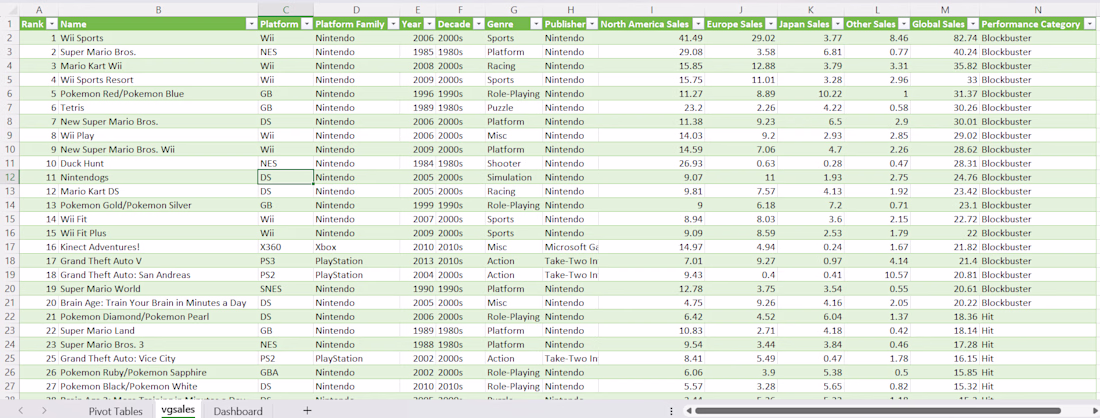
• Cleaned and structured raw datasets for analysis and reporting
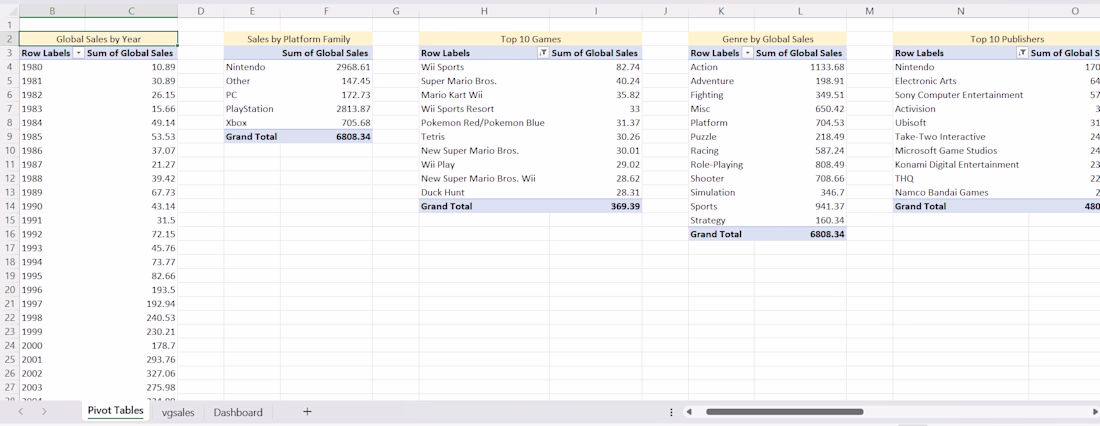
• Built Pivot Tables to analyze global and regional sales performance
• Designed an interactive dashboard using slicers for dynamic filtering
• Developed KPI cards to track Total Sales, Games, Platforms, and Genres
• Performed trend, comparative, and distribution analysis across multiple dimensions
Key Insights:
• Sports and Action genres dominated global sales
• Nintendo emerged as the leading publisher by overall sales
• The gaming market peaked during the late 2000s–early 2010s
• Platform analysis highlighted the strong market presence of Nintendo and PlayStation ecosystems
Tools Used:
Microsoft Excel | Pivot Tables | Slicers | Dashboard Design | Data Visualization
The network for creativity
Join 1.25M professional creatives like you
Connect with clients, get discovered, and run your business 100% commission-free
Creatives on Contra have earned over $150M and we are just getting started
Related posts
Simple messy data cleaned up into a table. Summary calculations created with pivot table and clustered column chart.
This is a document used to track KPI compliance monthly.
Built a Product Filter & Search App using HTML, CSS, and JS. Designed an eCommerce UI with real-time search, category filtering, and a dynamic product grid. Focused on dataset filtering logic and array-based DOM rendering.
Trending
Claude
Claude has entered the design space. How are you using Claude Design?
Contra University
Learn from expert creatives how to earn more using next-gen AI tools.
creativeaiflow
Creative AI workflows are evolving. What tools do you use, and what are their strengths and weaknesses?
portfolioreview
The best portfolios tell a story, not just show a grid. Share yours for feedback.
freelancerlife
Freelancer life is wins, pivots, and everything in between. What’s yours right now?