The network for creativity
Join 1.25M professional creatives like you
Connect with clients, get discovered, and run your business 100% commission-free
Creatives on Contra have earned over $150M and we are just getting started
Back to feedPost

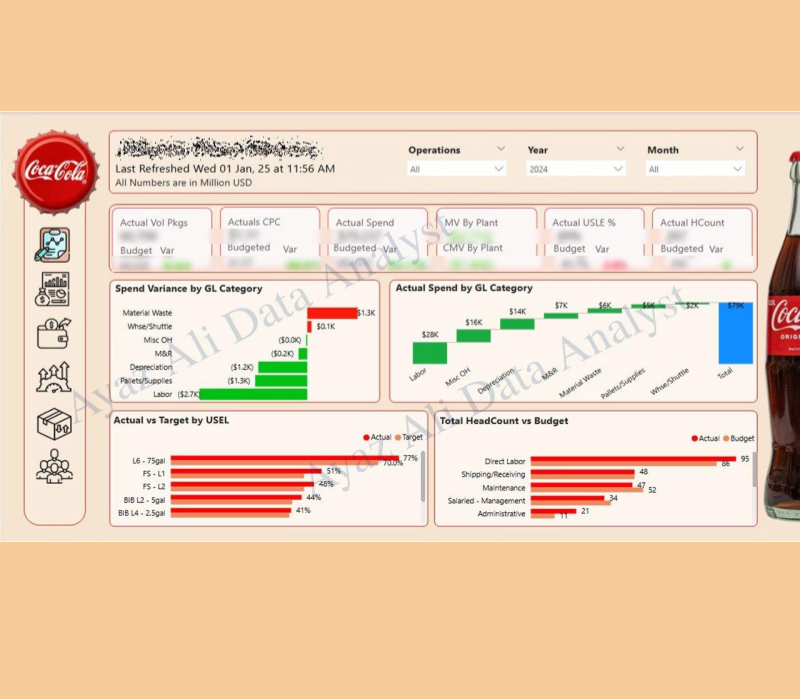
Coca-Cola Operations & Financial Performance Dashboard


The network for creativity
Join 1.25M professional creatives like you
Connect with clients, get discovered, and run your business 100% commission-free
Creatives on Contra have earned over $150M and we are just getting started





Related posts

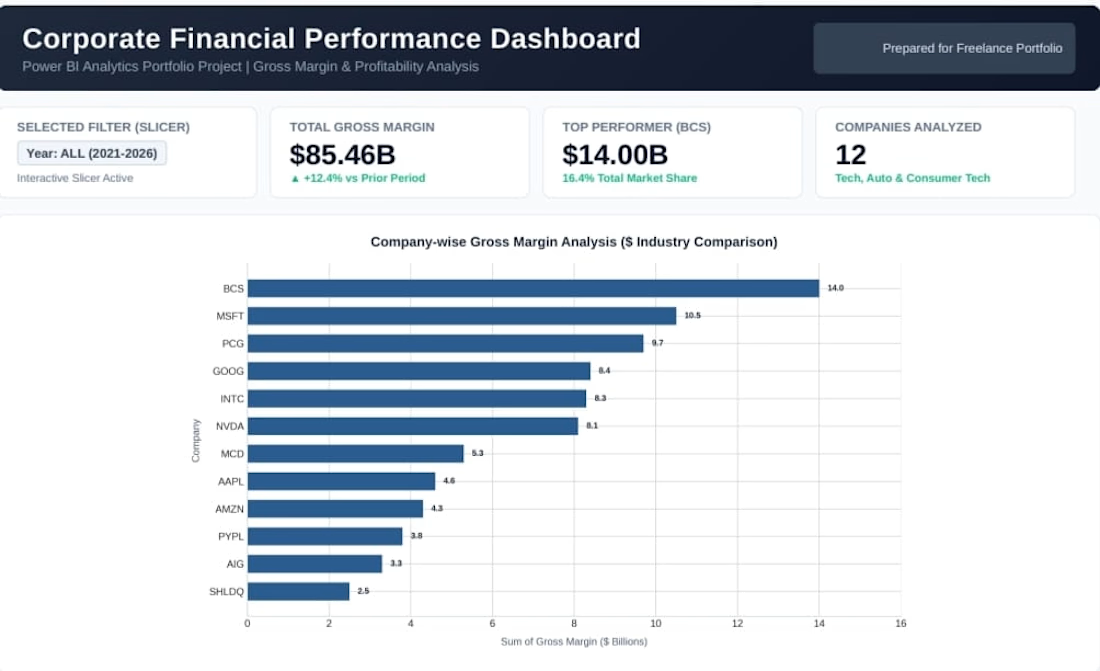
Corporate Financial Performance Dashboard Interactive financial dashboard built to track key business KPIs, revenue metrics, and gross margin analysis across entities for data-driven executive reporting.


👟 24+ Years Footwear Expert → Now Helping USA Shoe Brands 3X ROAS with Facebook & Instagram Ads
I just launched my new project: Facebook & Instagram Ads for Shoe Brands Only!
🚫 Why ONLY Shoe Brands?
I was Ex-Head Commercial of Top 3 Footwear Factory in Bangladesh. I know shoe buyer psychology, not just ads.
🎯 Recent Result: USA Hemp Sneaker Brand
ROAS 1.2x → 3.2x in 30 Days
CPC $0.80 → $0.35
Revenue $15k → $38k/mo
Most agencies run generic ads. I build:
✅ Shoe-buyer only audiences (Sneakerheads, not random interests)
✅ UGC Try-on + Factory Story Creatives
✅ Shopify + Subscription Funnel for Repeat Buyers
If you own a Shoe Brand (Sneakers, Boots, Sustainable Shoes like 8000Kicks), drop your store URL - I'll send you FREE 5-min audit with 3 mistakes losing you money.
Let's make your shoe brand the next 8000Kicks 🚀
#footwear #shoebrand #facebookads
footwearfootweardesignShopifyGoogle SheetsMicrosoft ExcelLead GenerationMarket ResearchProduct Research




Good Luck!


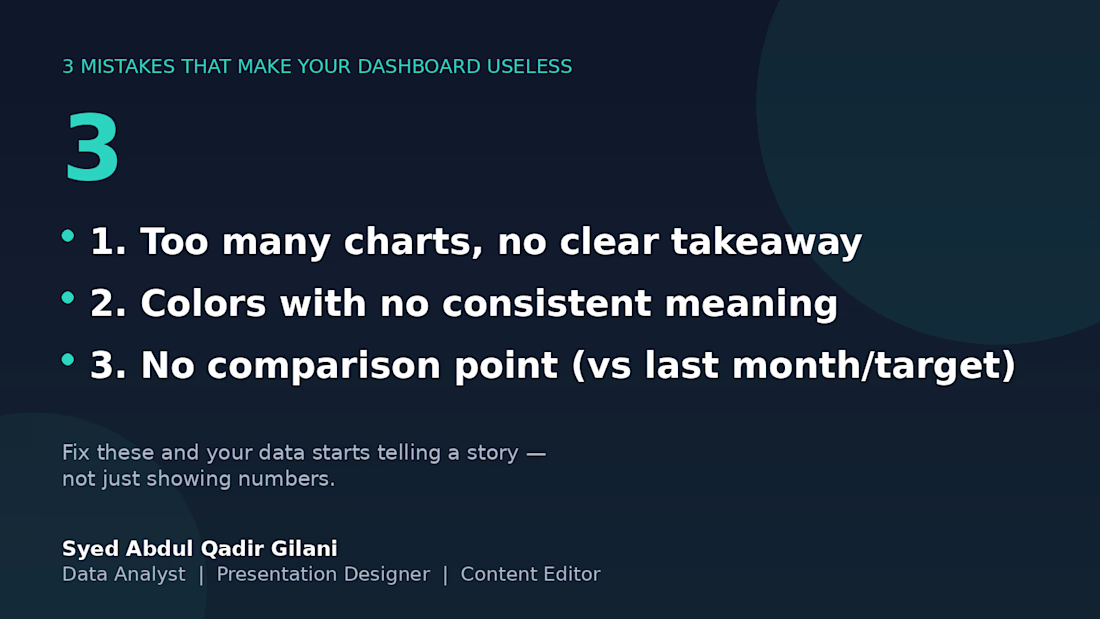
3 mistakes that will eventually make this board useless. 📉
I've reviewed several client dashboards over the years, and the same 3 problems show up over and over:
1️⃣ Too many charts, no clear takeaway — if I can't tell what to do after looking at it, it's decoration, not a dashboard.
2️⃣ Colors with no consistent meaning — red means "unacceptable" on one chart and "category 3" on the next. Pick a system and stick with it.
3️⃣ No comparison point — a number alone means nothing. "Revenue: $12,480" tells you nothing. "Revenue: $12,480 (+18% vs last month)" tells you everything.
Fix these three, and your data stops being numbers on a page — it starts being something people actually use to decide.
What's the most common dashboard mistake you've seen? 👇