The network for creativity
Join 1.25M professional creatives like you
Connect with clients, get discovered, and run your business 100% commission-free
Creatives on Contra have earned over $150M and we are just getting started
Back to feedPost
Emergency Operations & Capacity Analytics Dashboard is an interactive healthcare analytics project .The objective was to transform complex emergency department data into actionable insights that help identify operational bottlenecks, monitor hospital performance, and improve patient flow.
The dashboard analyzes 9,994 patient visits across 11 UK hospitals, covering key performance indicators such as wait times, readmission rates, bed occupancy, patient satisfaction, mortality, and length of stay. It also provides insights into hospital performance rankings, patient journey stages, seasonal demand patterns, and clinical outcomes.
This project strengthened my skills in data storytelling, business intelligence, frontend development, responsive UI design, and interactive dashboard development.
Technologies Used: Power BI • HTML5 • CSS3 • JavaScript • Chart.js • GitHub Pages
#DataAnalyst #DashboardDeveloper #PowerBIExpert #DataProjects
The network for creativity
Join 1.25M professional creatives like you
Connect with clients, get discovered, and run your business 100% commission-free
Creatives on Contra have earned over $150M and we are just getting started
Related posts
Dynamic composition and entire interaction loop are composed and running in unicorn studio. conceptually and technically dense.
check the live simulation soon.
Amazing!
Dark-themed real estate mobile app .
This appfocuses on creating a seamless property discovery experience through a clean layout, strong visual hierarchy, and carefully crafted details. Property images take center stage, while pricing, location, and key information remain easy to scan at a glance.
The dark interface helps highlight content, improves visual contrast, and gives the product a modern, premium feel.
Designed in Figma.
Need help bringing your product ideas to life? Let's connect.
Dark Real Estate Mobile App, Luxury Property App UI, Real Estate App Case Study, Property Listing Mobile UI, Modern Real Estate Dashboard, Premium Real Estate UX Design, Real Estate App Interaction Design,Mobile App Design Inspiration 2025/2026
Having worked together, I know how much thought and effort goes into your work. The attention to detail really shows here. Keep going — you're doing great things 💙
I can't decide between these two 😅 Which hero design do YOU prefer for a flight booking app?
Drop your vote! Which would make you hit Search Flights faster?
9 voted
82%
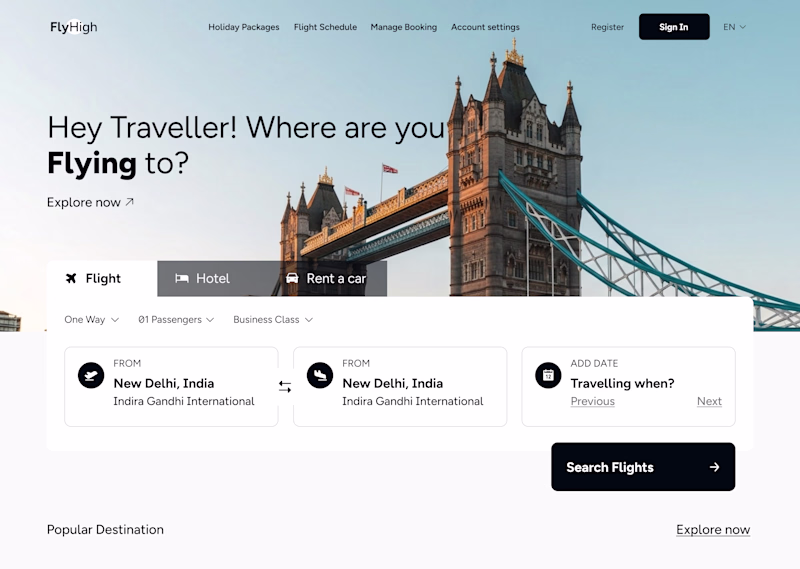
2 voted
18%
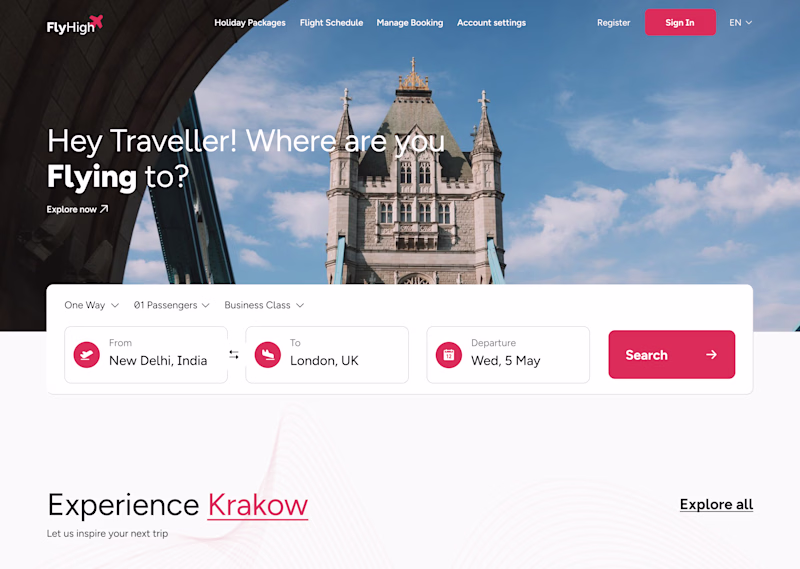
11 votes
Closed
Left Label is clear in context and visual.
Trending
Claude
Claude has entered the design space. How are you using Claude Design?
Contra University
Learn from expert creatives how to earn more using next-gen AI tools.
MagicPath
The canvas is infinite, and exploration is becoming the workflow. How are you using MagicPath?
creativeaiflow
Creative AI workflows are evolving. What tools do you use, and what are their strengths and weaknesses?
freelancerlife
Freelancer life is wins, pivots, and everything in between. What’s yours right now?