The network for creativity
Join 1.25M professional creatives like you
Connect with clients, get discovered, and run your business 100% commission-free
Creatives on Contra have earned over $150M and we are just getting started
Back to feedPost

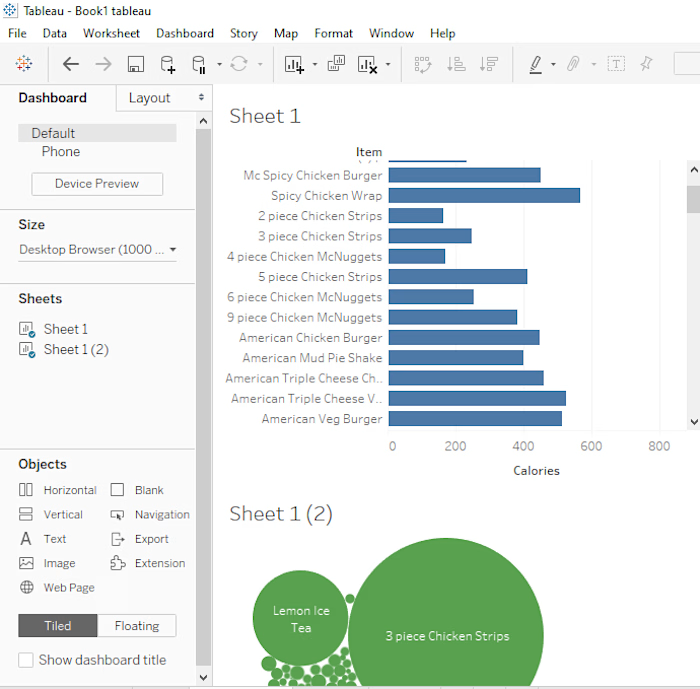
McDonald's Nutritional & Calories Visual Analytics (Tableau)
Overview:
Developed an interactive Tableau dashboard to analyze and visualize nutritional profiles across McDonald's food products, focusing on key metrics like calorie count and trans-fat composition.
Tools: Tableau
Key Analysis & Process:
Nutritional Breakdown: Categorized menu items to compare caloric intake and trans-fat levels across different product categories.
Visual Mapping: Built custom bar charts and comparison visuals in Tableau to highlight high-density nutritional values at a glance.
Outcome:
Delivered a clean, visual summary that allows users and stakeholders to quickly evaluate menu items based on health and nutrition metrics.

The network for creativity
Join 1.25M professional creatives like you
Connect with clients, get discovered, and run your business 100% commission-free
Creatives on Contra have earned over $150M and we are just getting started







Related posts

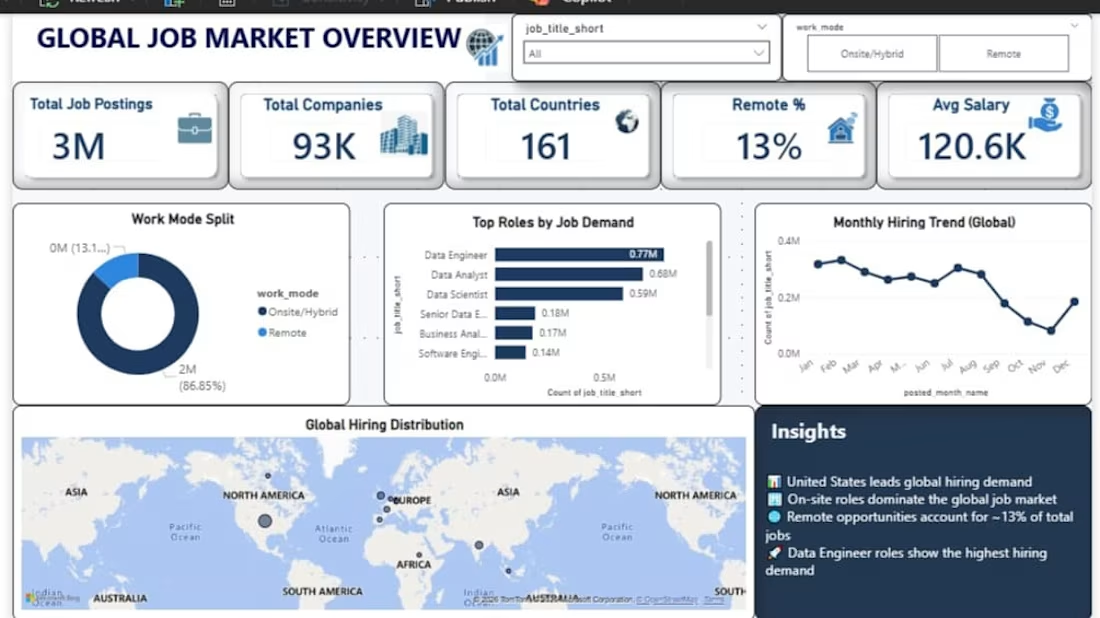
I analyzed 3M+ job postings across 161 countries and 93K companies to identify hiring trends, in-demand roles, work-mode patterns, and salary insights.
I used Python for data cleaning and preprocessing, SQL for analysis, and Power BI to build an interactive dashboard.
Key areas analyzed:
• Global hiring demand
• Top job roles by demand
• Remote vs. onsite/hybrid work patterns
• Average salary trends
• Monthly hiring trends
This project helped me turn a large dataset into clear, actionable insights for understanding the global job market.



Viral visualizer project reaching over 500K+ organic views on Instagram.


The visual hook clearly did its job.

Dashboard Key Highlights:
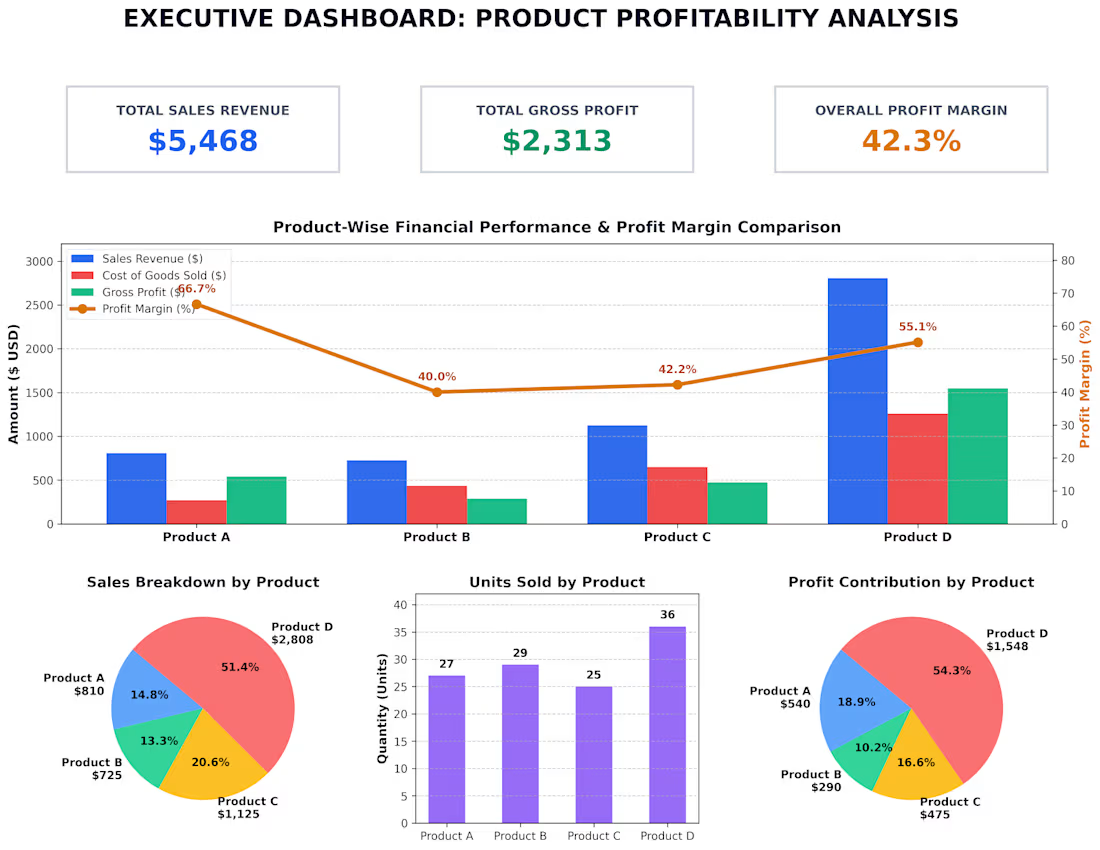
Total Performance: Total Revenue of $5,468 and Gross Profit of $2,313 with an overall profit margin of 42.3%.
Top Profit Contributor: Product D yields the highest gross profit at $1,548 (54.3% of total profit) and revenue of $2,808 (51.4% of total sales).
Highest Margin Product: Product A leads in efficiency with a 66.7% profit margin ($540 profit on $810 sales).