The network for creativity
Join 1.25M professional creatives like you
Connect with clients, get discovered, and run your business 100% commission-free
Creatives on Contra have earned over $150M and we are just getting started
Back to feedPost

Project Overview
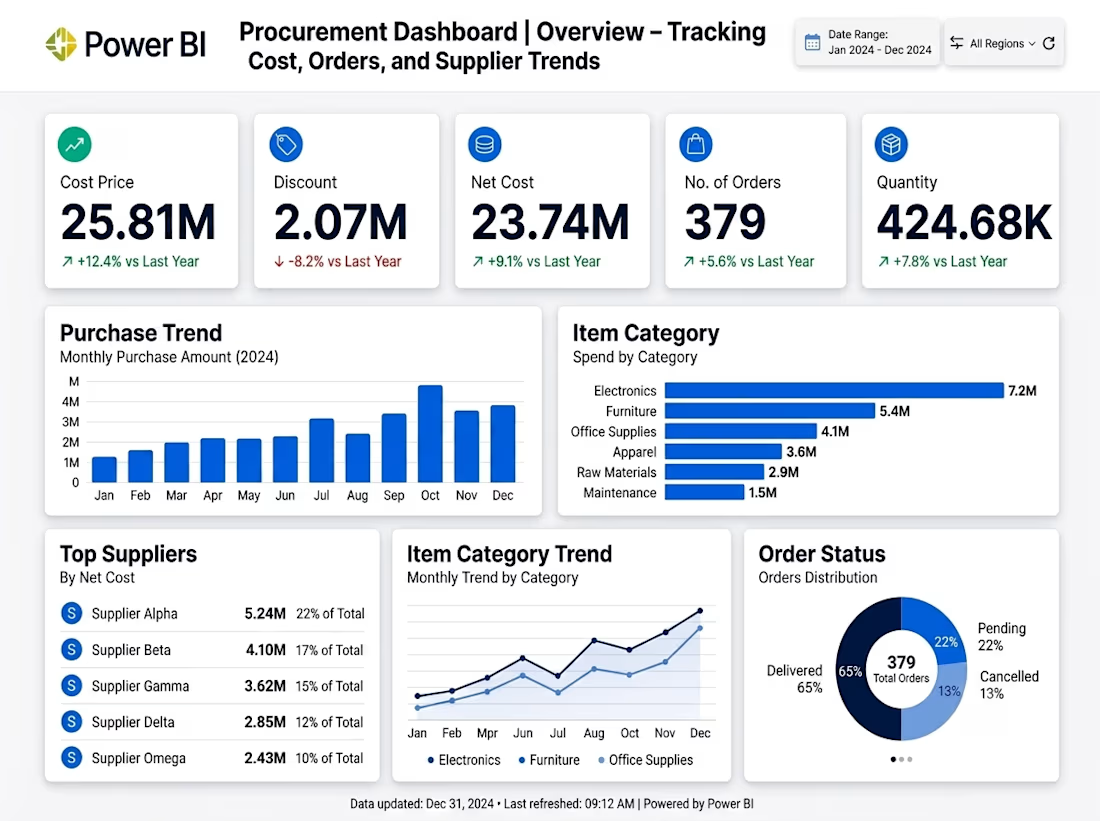
A data-driven Procurement Analytics Dashboard built in Power BI to monitor purchasing performance, vendor concentration, and order lifecycle management. It helps business managers optimize procurement costs and improve supply chain efficiency.
Key Highlights & Features
Financial Metrics (KPIs): Tracks total cost ($25.81M), discounts achieved ($2.07M), net procurement cost ($23.74M), and overall order quantities.
Spend by Category: Visualizes expense breakdown across key categories such as Electronics ($7.2M), Furniture ($5.4M), and Office Supplies.
Supplier Analysis: Identifies top suppliers by net spend (e.g., Supplier Alpha at 22% of total spend) to evaluate vendor risk and dependency.
Order Status Breakdown: Real-time visibility into order execution (65% Delivered, 22% Pending, 13% Cancelled).
Monthly Purchase Trends: Highlights spending patterns across the year (2024) to assist in seasonal budget planning.
Tools & Technologies
Power BI (Dashboard Design & DAX Visualizations)
Data Analytics & Visualization
Supply Chain & Financial Insights


The network for creativity
Join 1.25M professional creatives like you
Connect with clients, get discovered, and run your business 100% commission-free
Creatives on Contra have earned over $150M and we are just getting started
Trending

Claude
Claude has entered the design space. How are you using it?

Contra University
Learn from expert creatives how to earn more using next-gen AI tools.
Brand Design
The best brand designers are on Contra. Scroll to see what's trending in brand design. What are you building?
creativeaiflow
Creative AI workflows are evolving. What tools do you use, and what are their strengths and weaknesses?
freelancerlife
Freelancer life is wins, pivots, and everything in between. What’s yours right now?






Related posts

🏦 Insurance Claims Analytics Dashboard
Description:
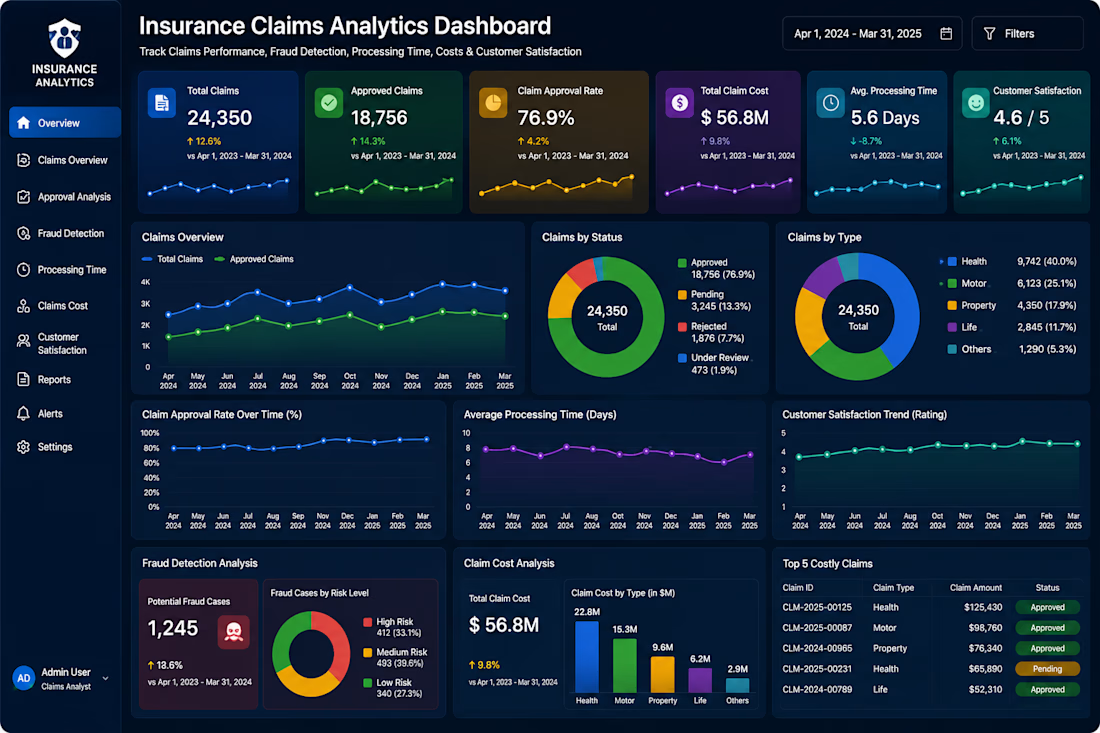
Built a professional Insurance Claims Analytics Dashboard to help insurance companies streamline claims management, monitor operational performance, detect fraud, and improve customer satisfaction through data-driven insights.
This dashboard provides a complete overview of Claims Overview, Claim Approval Rate, Fraud Detection, Processing Time, Claim Cost Analysis, Customer Satisfaction, and Executive KPIs with interactive visualizations and real-time reporting. It enables insurance teams to identify claim trends, reduce processing delays, minimize fraudulent activities, optimize claim costs, and enhance overall operational efficiency.
Developed using Microsoft Power BI, SQL, and Microsoft Excel, this solution transforms complex insurance data into meaningful business intelligence through dynamic dashboards, KPI cards, drill-through reports, and executive-level analytics, empowering organizations to make faster and more informed decisions.
Key Features
🏦 Claims Overview & Executive KPIs
✅ Claim Approval Rate Analysis
🔍 Fraud Detection & Risk Monitoring
⏱️ Claim Processing Time Analysis
💰 Claim Cost & Financial Insights
⭐ Customer Satisfaction Tracking
Client Note
Looking for a custom Insurance Analytics Dashboard tailored to your business? I build clean, interactive, and executive-level Business Intelligence solutions that transform raw insurance data into actionable insights. Every dashboard is designed to improve operational efficiency, reduce claim processing time, support fraud detection, and enable smarter business decisions. If you need a customized solution for your organization, feel free to get in touch to discuss your project requirements.


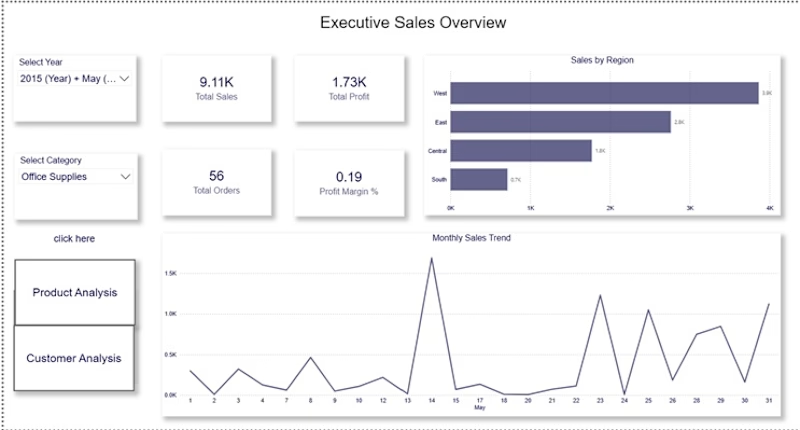
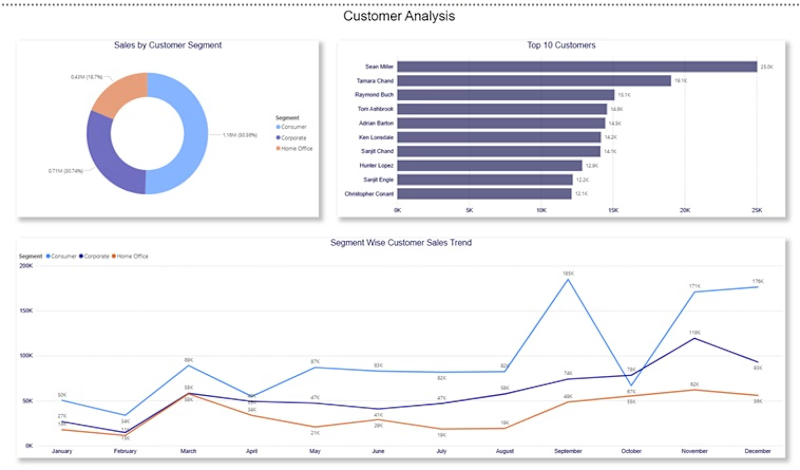
Developed an interactive Sales Performance Dashboard in Power BI to provide a comprehensive view of sales, profit, customer, and product performance. The dashboard includes KPI tracking for Total Sales, Total Profit, Total Orders, and Profit Margin, along with regional sales analysis, monthly sales trends, product performance insights, and customer segmentation. Implemented interactive filters, DAX measures, and data modeling to enable self-service analytics.The solution helps stakeholders monitor business performance, identify growth opportunities and make data-driven decisions efficiently.

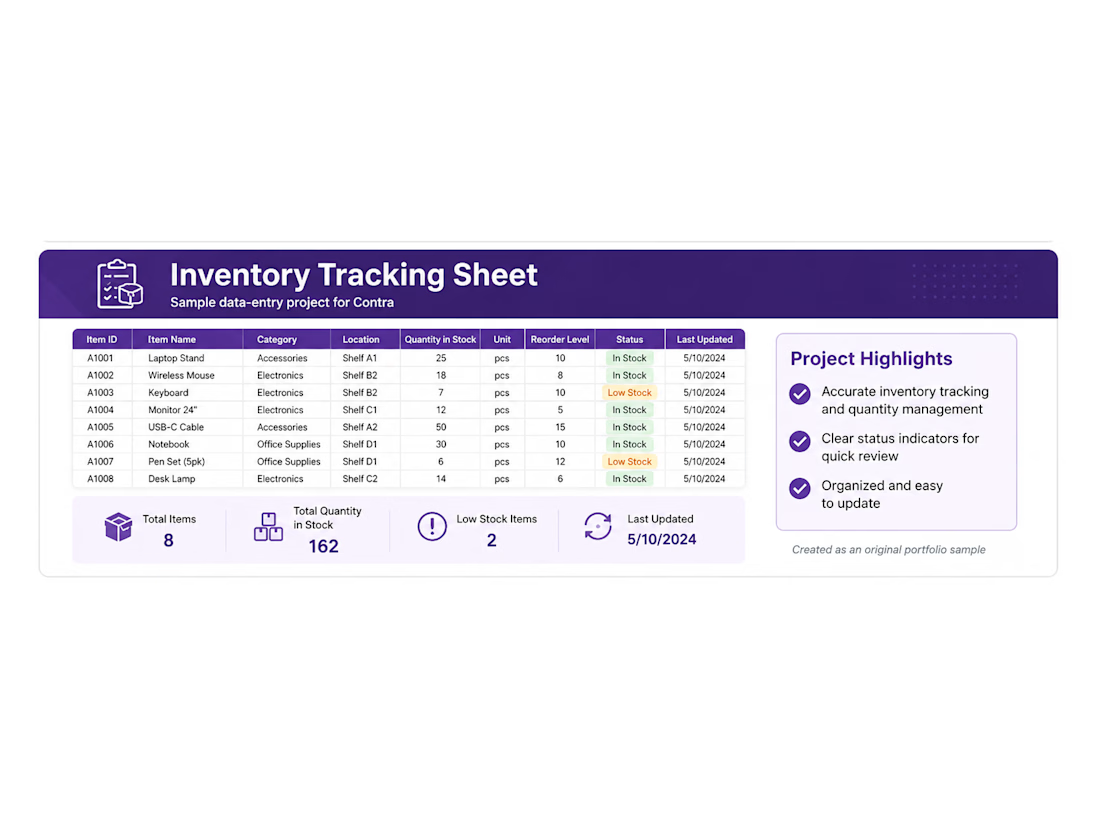
I created an organized inventory tracking spreadsheet to record item IDs, product names, categories, storage locations, quantities, reorder levels, stock status, and update dates. I used clear formatting and status labels to make low-stock items easy to identify and the file simple to maintain.