The network for creativity
Join 1.25M professional creatives like you
Connect with clients, get discovered, and run your business 100% commission-free
Creatives on Contra have earned over $150M and we are just getting started
Back to feedPost
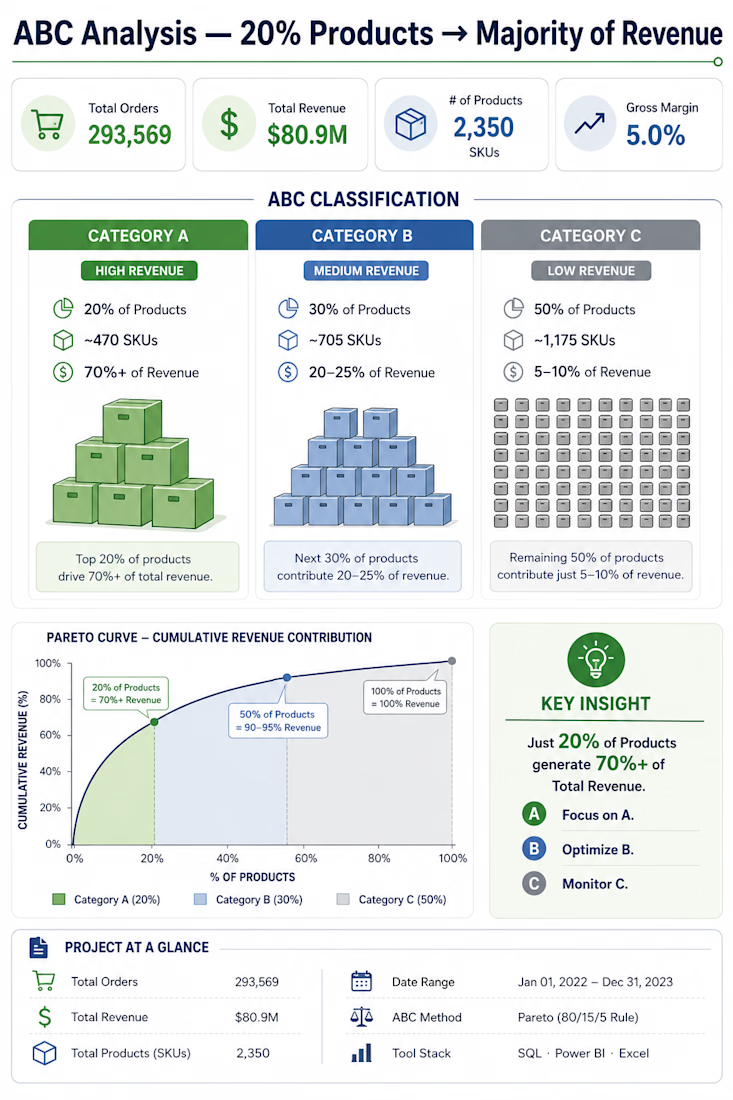
ABC Classification (Pareto Analysis) — SQL-Based Inventory Prioritization
Analyzed 293,569 orders and 2,350 SKUs to identify which products actually drive revenue — and which don't.
Approach:
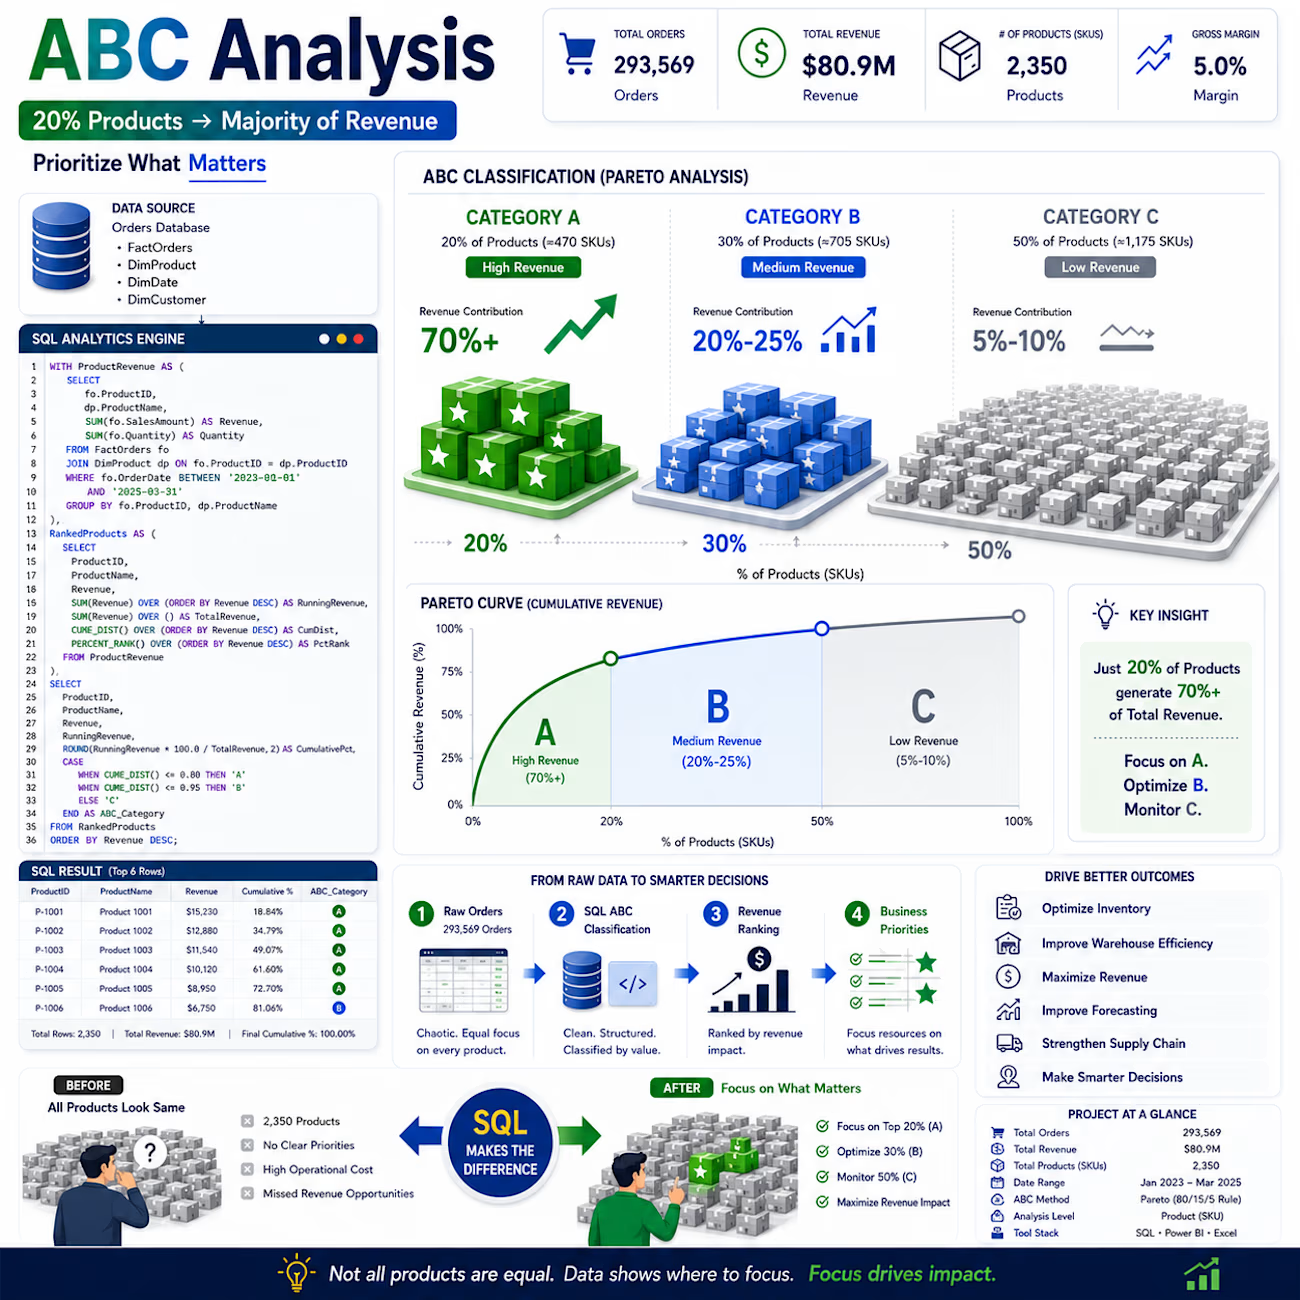
Built a CTE-based ABC classification in SQL Server, ranking products by cumulative revenue contribution using window functions (SUM() OVER, CUME_DIST(), PERCENT_RANK()), then segmented into three tiers based on Pareto thresholds.
Result:
Category A (20% of products) → 70%+ of total revenue
Category B (30% of products) → 20-25% of revenue
Category C (50% of products) → 5-10% of revenue
Business impact:
This reprioritizes where operational effort should go — tighter stock monitoring and faster reordering for Category A, reduced tracking overhead for Category C. The same logic fed into a related late-delivery root cause analysis on the same dataset.
Stack: SQL Server · Tableau

Full breakdown (SQL queries, dashboards, and methodology) available here: https://github.com/imransamiya817-debug/RetailPulse
The network for creativity
Join 1.25M professional creatives like you
Connect with clients, get discovered, and run your business 100% commission-free
Creatives on Contra have earned over $150M and we are just getting started
Related posts

Financial Trend Analysis & Customer Churn Dashboard





Great visualization! Which library or tool did you use to create this?

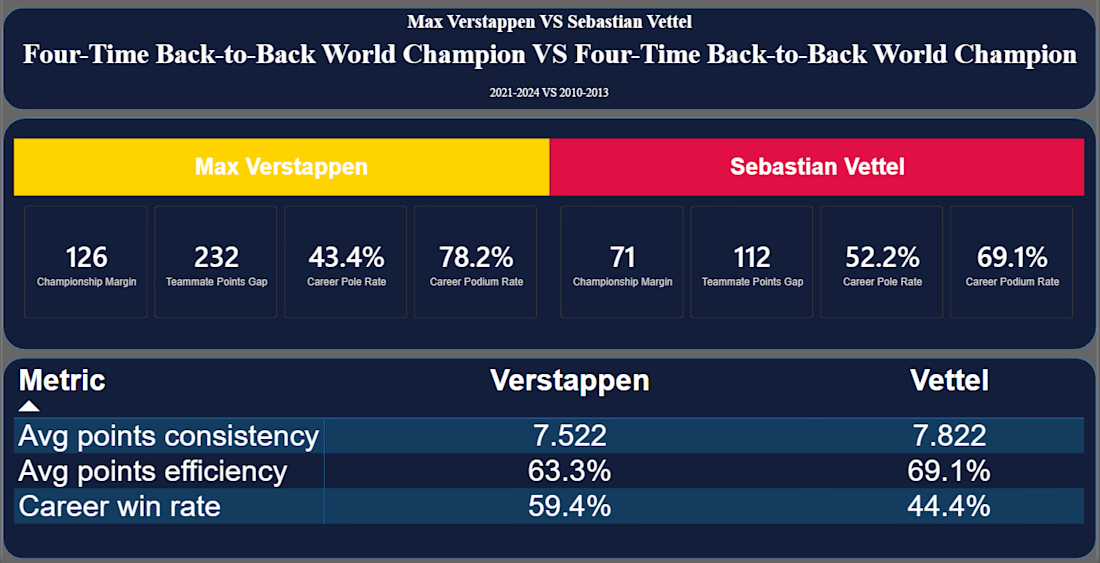
F1 Data Analysis: Vettel vs Verstappen — SQL & Power BI
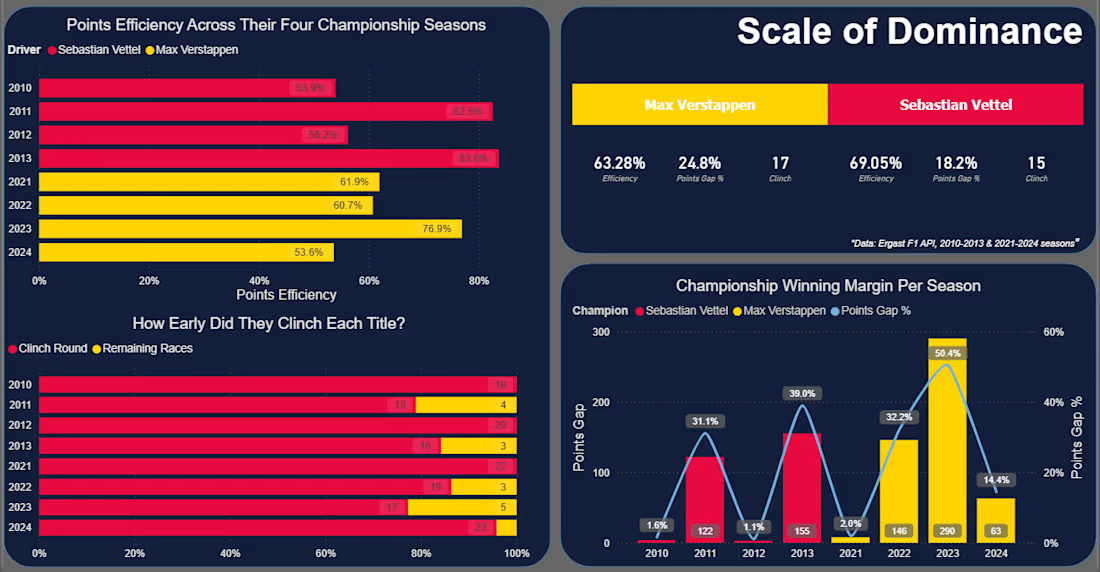
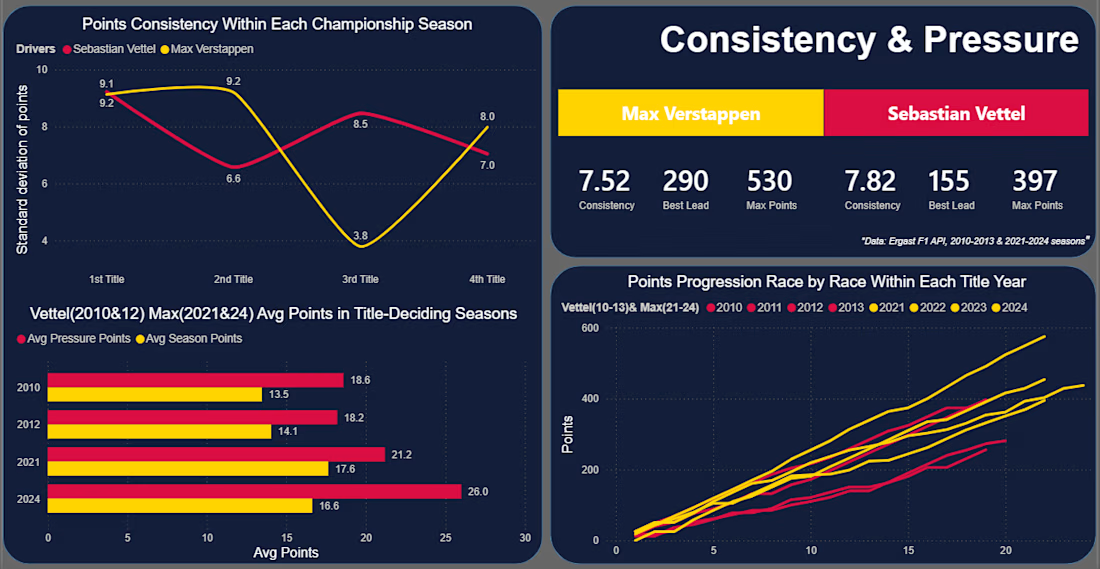
A SQL + Power BI comparison of Sebastian Vettel's (2010–2013) and Max Verstappen's (2021–2024) four-title runs at Red Bull Racing — same team, different eras, very different paths to the top.
Built on the Ergast F1 database: 14 SQL queries across 5 categories (dominance, race execution, consistency, teammate benchmarking), visualized in a 5-page Power BI dashboard.
Key finding: Vettel converted a higher share of available points on average (69.05% vs Verstappen's 63.28%), despite winning fewer races overall.
Tech Stack
SQL Server · DBeaver · Power BI · Excel
Full project: github.com/MZT49/four-time-champions-vettel-vs-verstappen













Trending

Claude
Claude has entered the design space. How are you using Claude Design?

Contra University
Learn from expert creatives how to earn more using next-gen AI tools.
creativeaiflow
Creative AI workflows are evolving. What tools do you use, and what are their strengths and weaknesses?
freelancerlife
Freelancer life is wins, pivots, and everything in between. What’s yours right now?