The network for creativity
Join 1.25M professional creatives like you
Connect with clients, get discovered, and run your business 100% commission-free
Creatives on Contra have earned over $150M and we are just getting started
Back to feedPost
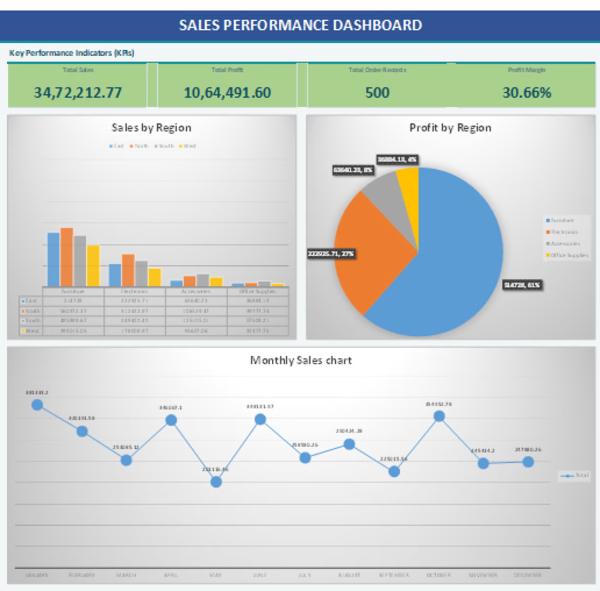
📊 My Excel Sales Dashboard Project
I'm building my Data Analyst portfolio through hands-on projects using sample sales data and Microsoft Excel.
For this project, I explored monthly sales trends, compared regional performance, analyzed category profitability, and used PivotTables and charts to present the findings.
I'm continuing to improve my skills in data cleaning, analysis, and visualization by turning raw data into meaningful insights.
I'd love to hear feedback from the community!
#DataAnalysis #MicrosoftExcel #DataVisualization #Dashboard
The network for creativity
Join 1.25M professional creatives like you
Connect with clients, get discovered, and run your business 100% commission-free
Creatives on Contra have earned over $150M and we are just getting started









Related posts

How I Built an End-to-End Sales Analytics Dashboard in Excel for an E-commerce Company
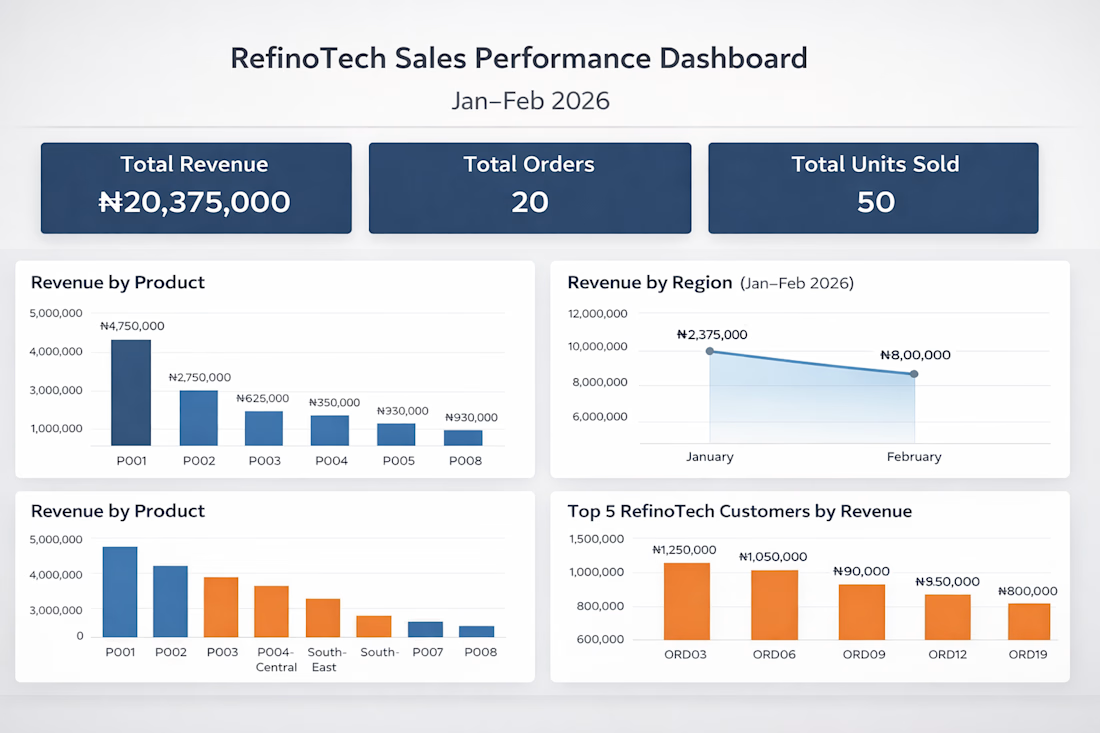
I recently completed an end-to-end sales analytics project using Microsoft Excel, transforming raw e-commerce sales data into an interactive dashboard that provides meaningful business insights.
In this project, I explored the data, performed analysis, identified key sales trends, and built an interactive dashboard to help businesses make data-driven decisions.
I documented the entire process, including the approach, tools, analysis, and dashboard development.
Read the full project walkthrough on Medium: https://medium.com/@Refino/how-i-built-an-end-to-end-sales-analytics-dashboard-in-excel-for-an-e-commerce-company-e8692d81f354



Excellent work! Turning raw data into actionable business insights is a valuable skill.


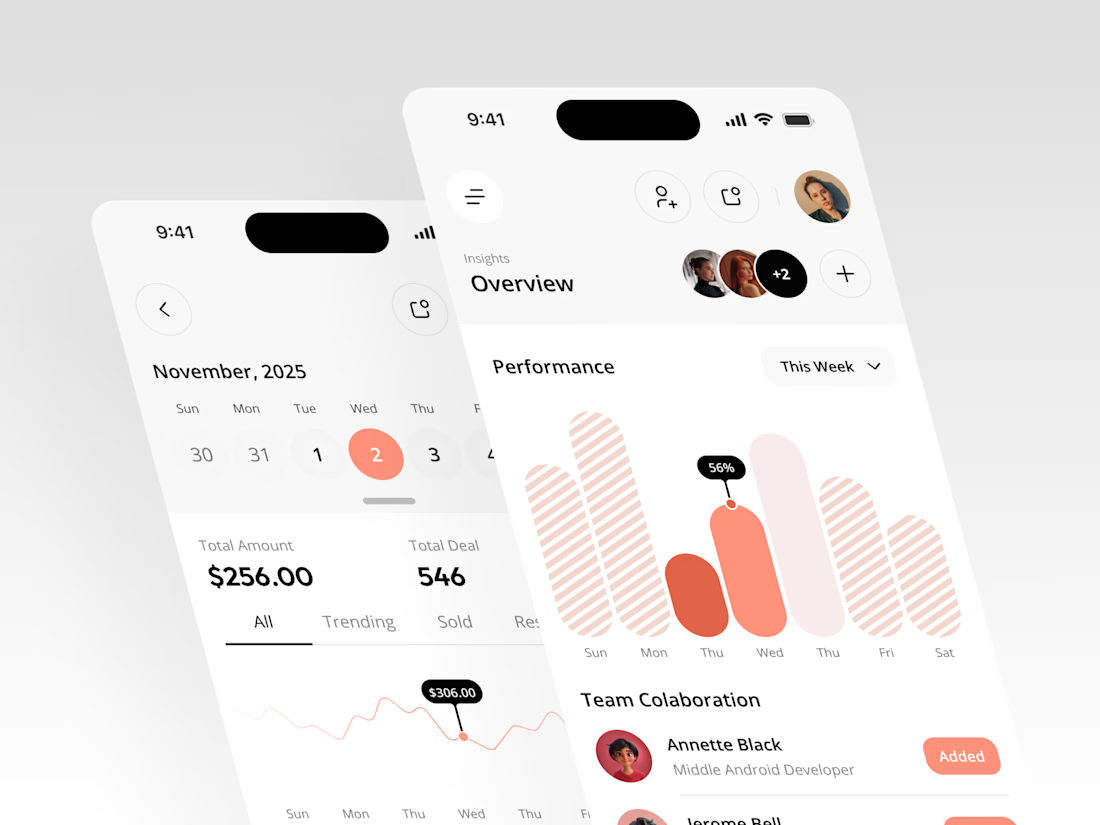

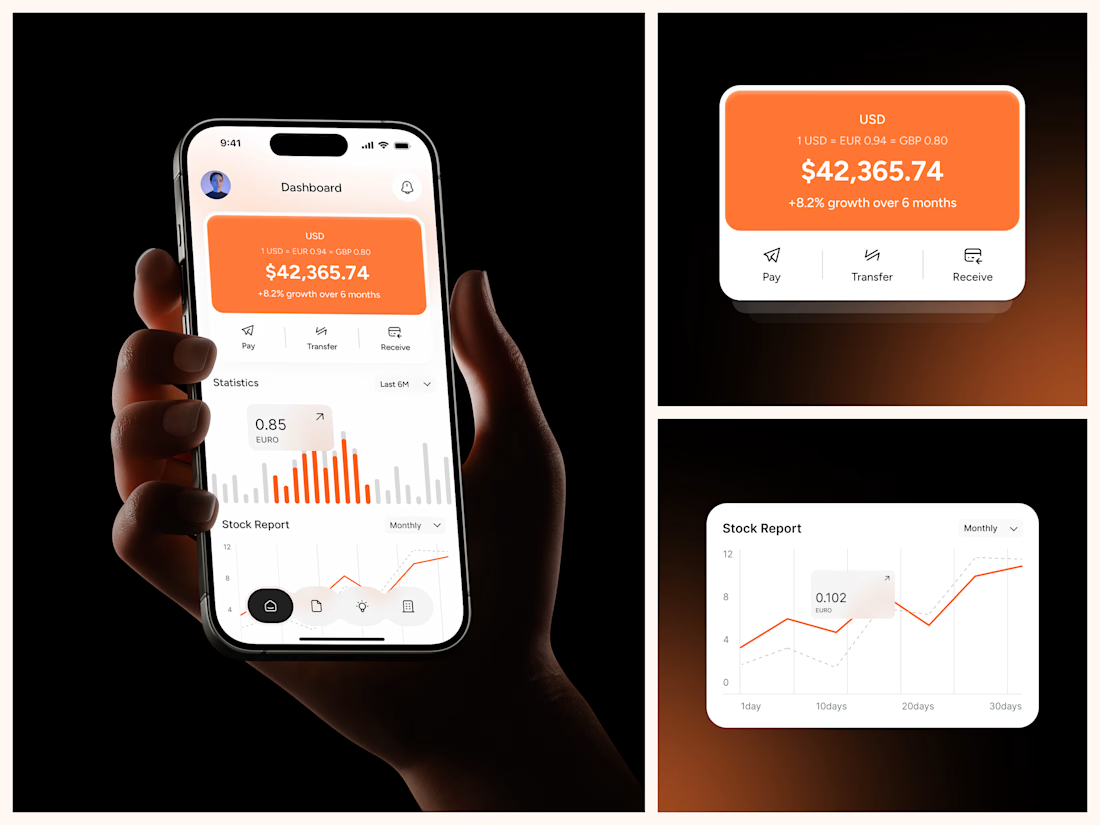

The coral red charts against the dark phone-in-hand shots make this pop, Rakesh. That Performance bar visual with the team collaboration section underneath gives the whole thing a real product feel. Clean mobile dashboard work.

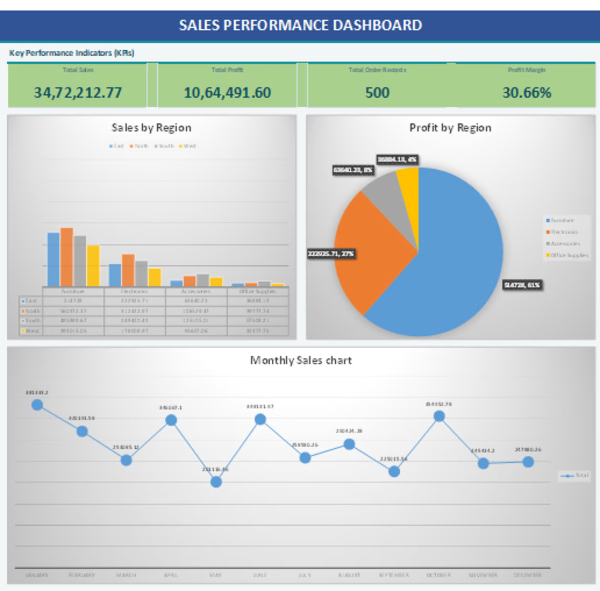
📊 My Excel Sales Dashboard Project
I'm building my Data Analyst portfolio through hands-on projects using sample sales data and Microsoft Excel.
For this project, I explored monthly sales trends, compared regional performance, analyzed category profitability, and used PivotTables and charts to present the findings.
I'm continuing to improve my skills in data cleaning, analysis, and visualization by turning raw data into meaningful insights.
I'd love to hear feedback from the community!
#DataAnalysis #MicrosoftExcel #DataVisualization #Dashboard