The network for creativity
Join 1.25M professional creatives like you
Connect with clients, get discovered, and run your business 100% commission-free
Creatives on Contra have earned over $150M and we are just getting started
Back to feedPost

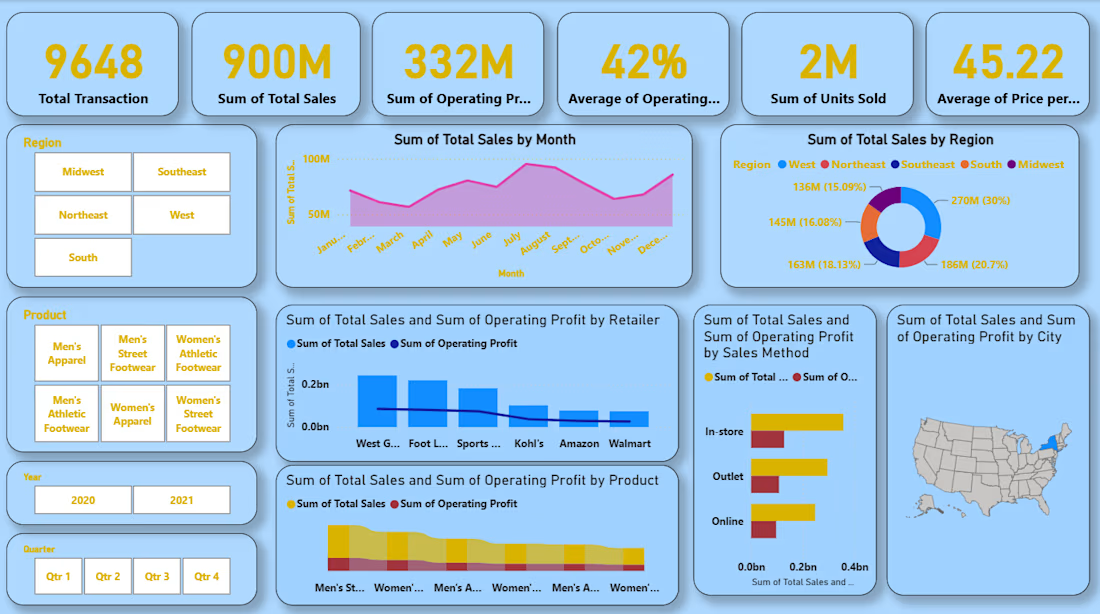
Interactive Sales Performance Dashboard in Power BI
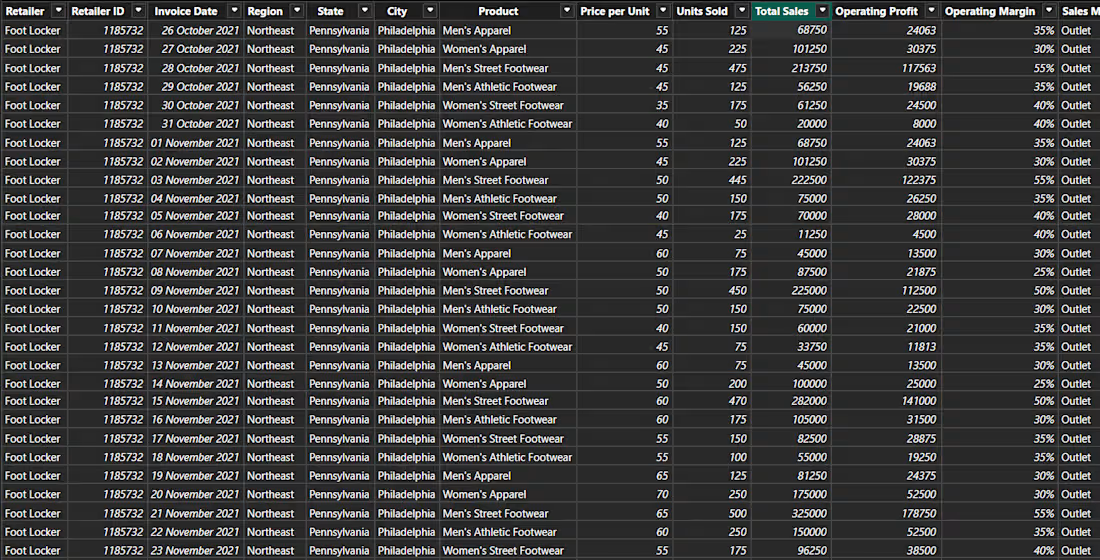
Retail Sales Performance Dashboard is an interactive Power Bi solution designed to help businesses monitor, analyze, and optimize their sales performance across regions, retailers, products and sales channels. The dashboard provides a unified view of key performance indicators(KPIs), sales trends, profitability and geographic performance to support data-driven business decision.
It enables stakeholders to quickly identify top performing region, profitable retailers, best-selling product categories, and seasonal sales patterns through dynamic visualizations and interactive filters. By combining sales, profit, and operational metrics into a single dashboard, the solution helps businesses improve performance, uncover growth opportunities and make informed strategic decisions.
Industry: Retail/Sales Analytics
Key Focus Areas: Sales performance, profitability analysis, regional insights, retailer comparison, product analysis, KPI monitoring, interactive Reporting

The network for creativity
Join 1.25M professional creatives like you
Connect with clients, get discovered, and run your business 100% commission-free
Creatives on Contra have earned over $150M and we are just getting started
Trending

Claude
Claude has entered the design space. How are you using Claude Design?

Contra University
Learn from expert creatives how to earn more using next-gen AI tools.
creativeaiflow
Creative AI workflows are evolving. What tools do you use, and what are their strengths and weaknesses?
freelancerlife
Freelancer life is wins, pivots, and everything in between. What’s yours right now?








Related posts

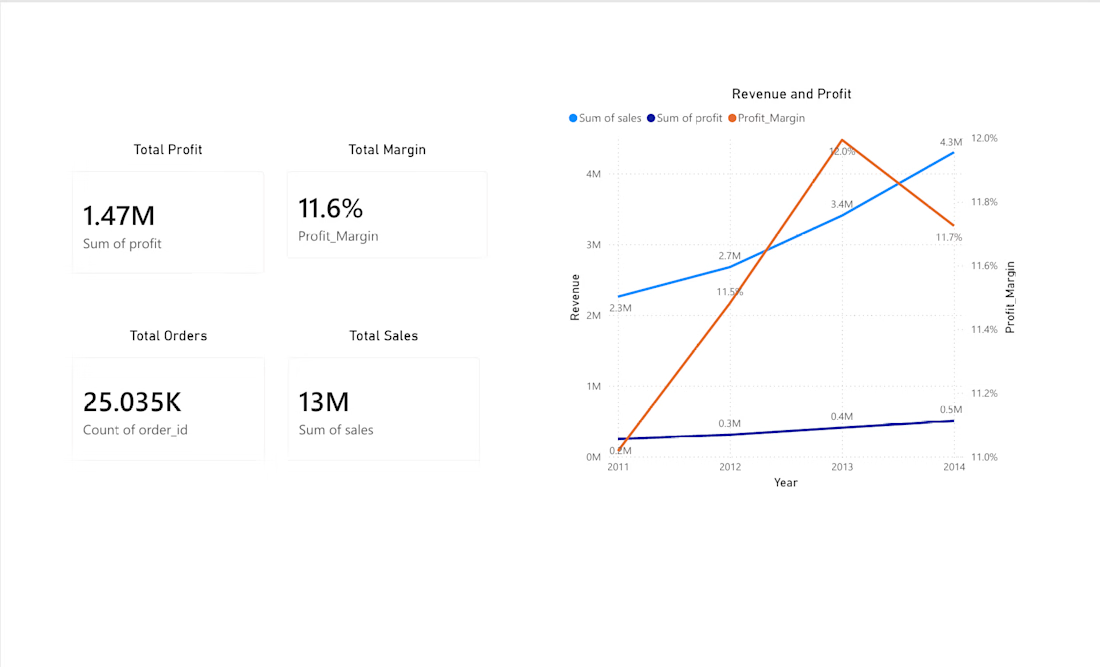
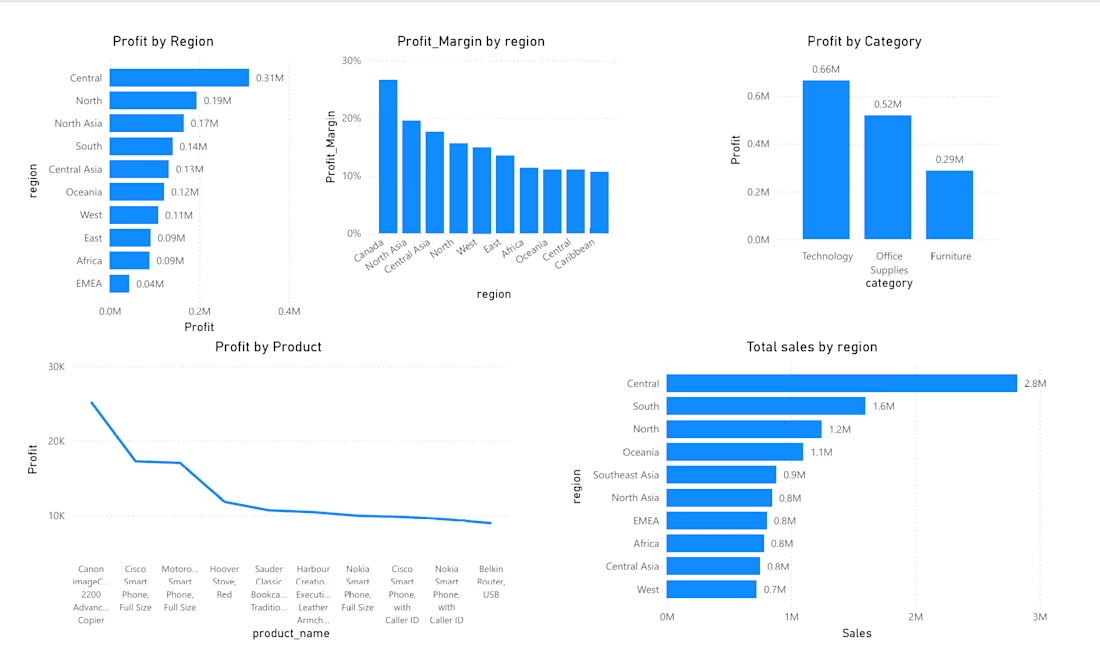
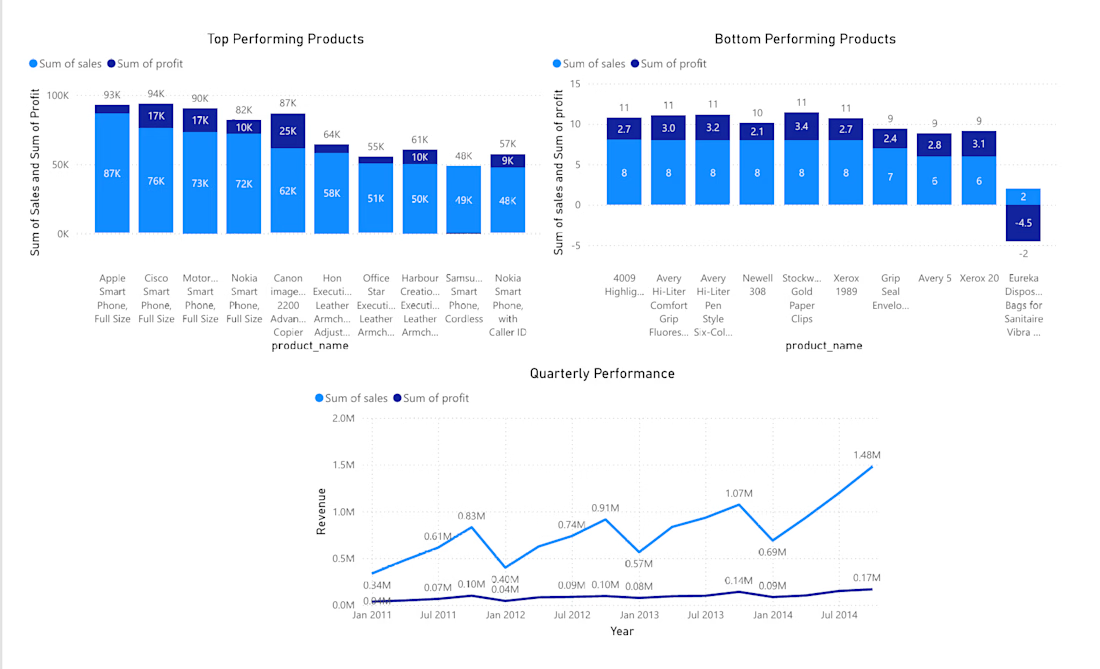
Superstore Sales & Profitability Dashboard
Interactive Power BI dashboard analyzing 4 years of retail sales data. Includes revenue and profit tracking by region, category, and product, profit margin analysis to identify high-revenue vs high-margin segments, and top/bottom performing product breakdowns. Built to help retail businesses spot where they're making money — not just where they're generating sales.
Tools: Power BI, DAX


Project Overview
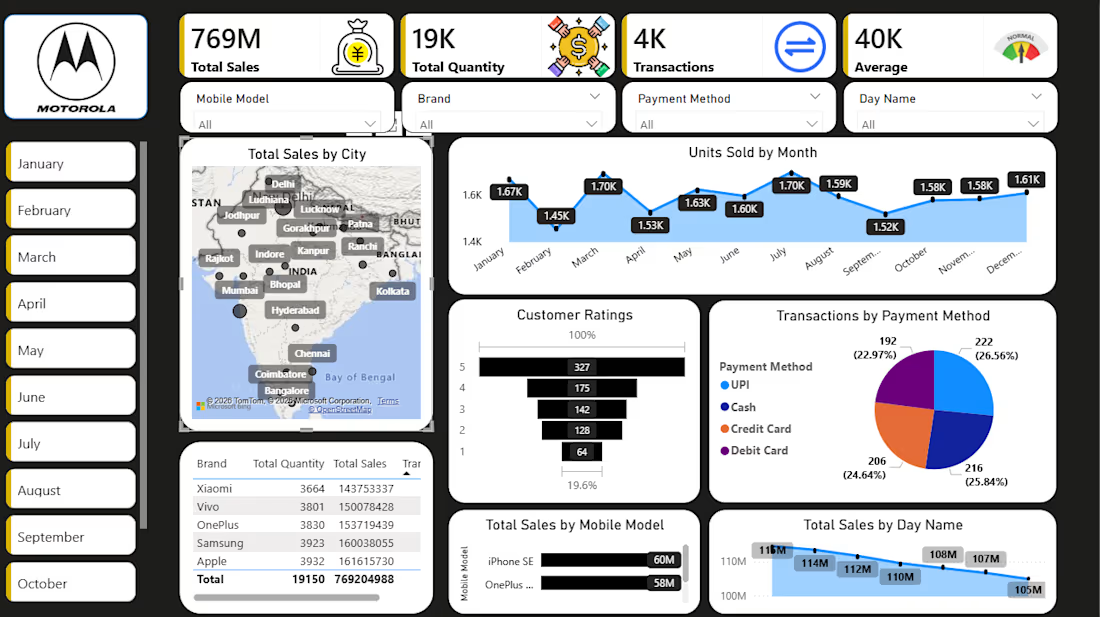
This Mobile Sales Analytics Dashboard provides a detailed overview of smartphone sales performance, customer satisfaction ratings, and purchasing trends across major Indian cities and top mobile brands. Built for retail and market analytics, it translates sales and inventory metrics into visual insights to optimize regional supply chains and product positioning.

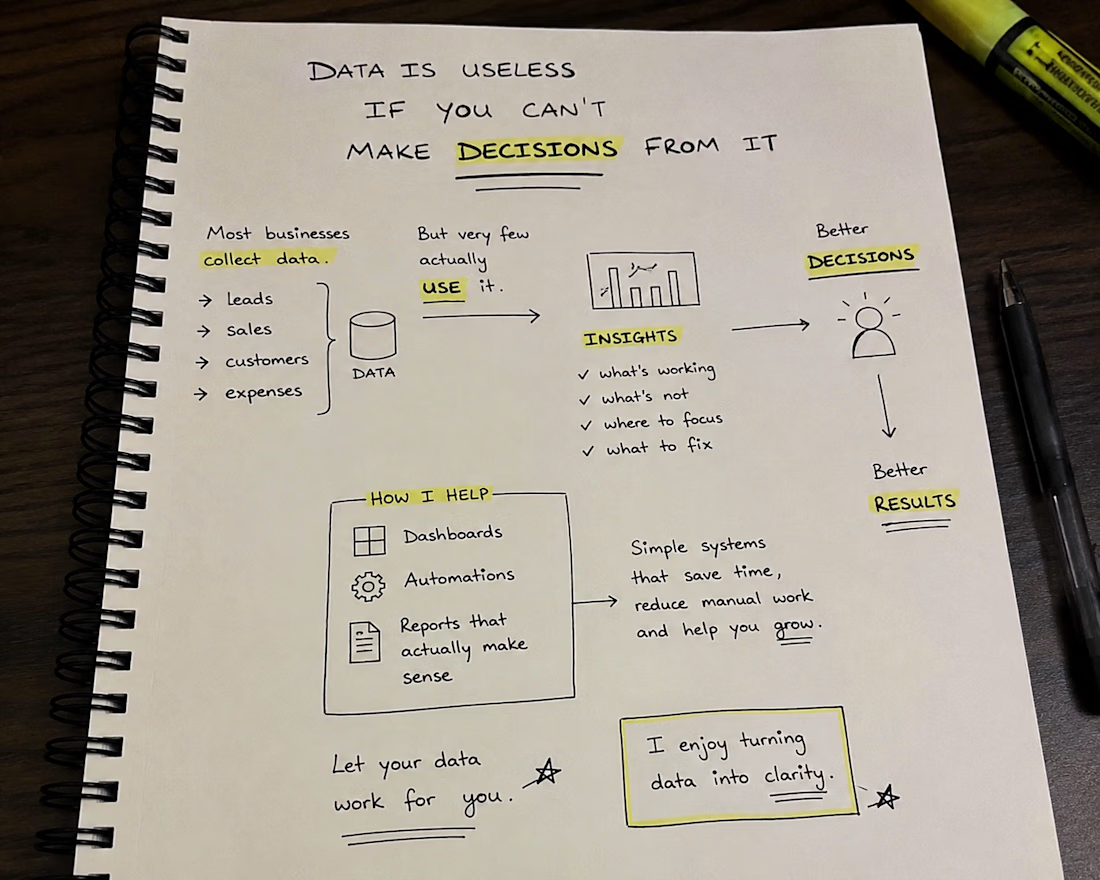
I used to think dashboards were just about making data look good.
The more I worked with data, the more I realized that's not the point.
A good dashboard should answer questions instantly.
• What's working?
• What needs attention?
• What should I do next?
If you still have to open five spreadsheets to find those answers, your data isn't really working for you.
That's the kind of problem I enjoy solving.