The network for creativity
Join 1.25M professional creatives like you
Connect with clients, get discovered, and run your business 100% commission-free
Creatives on Contra have earned over $150M and we are just getting started
Back to feedPost

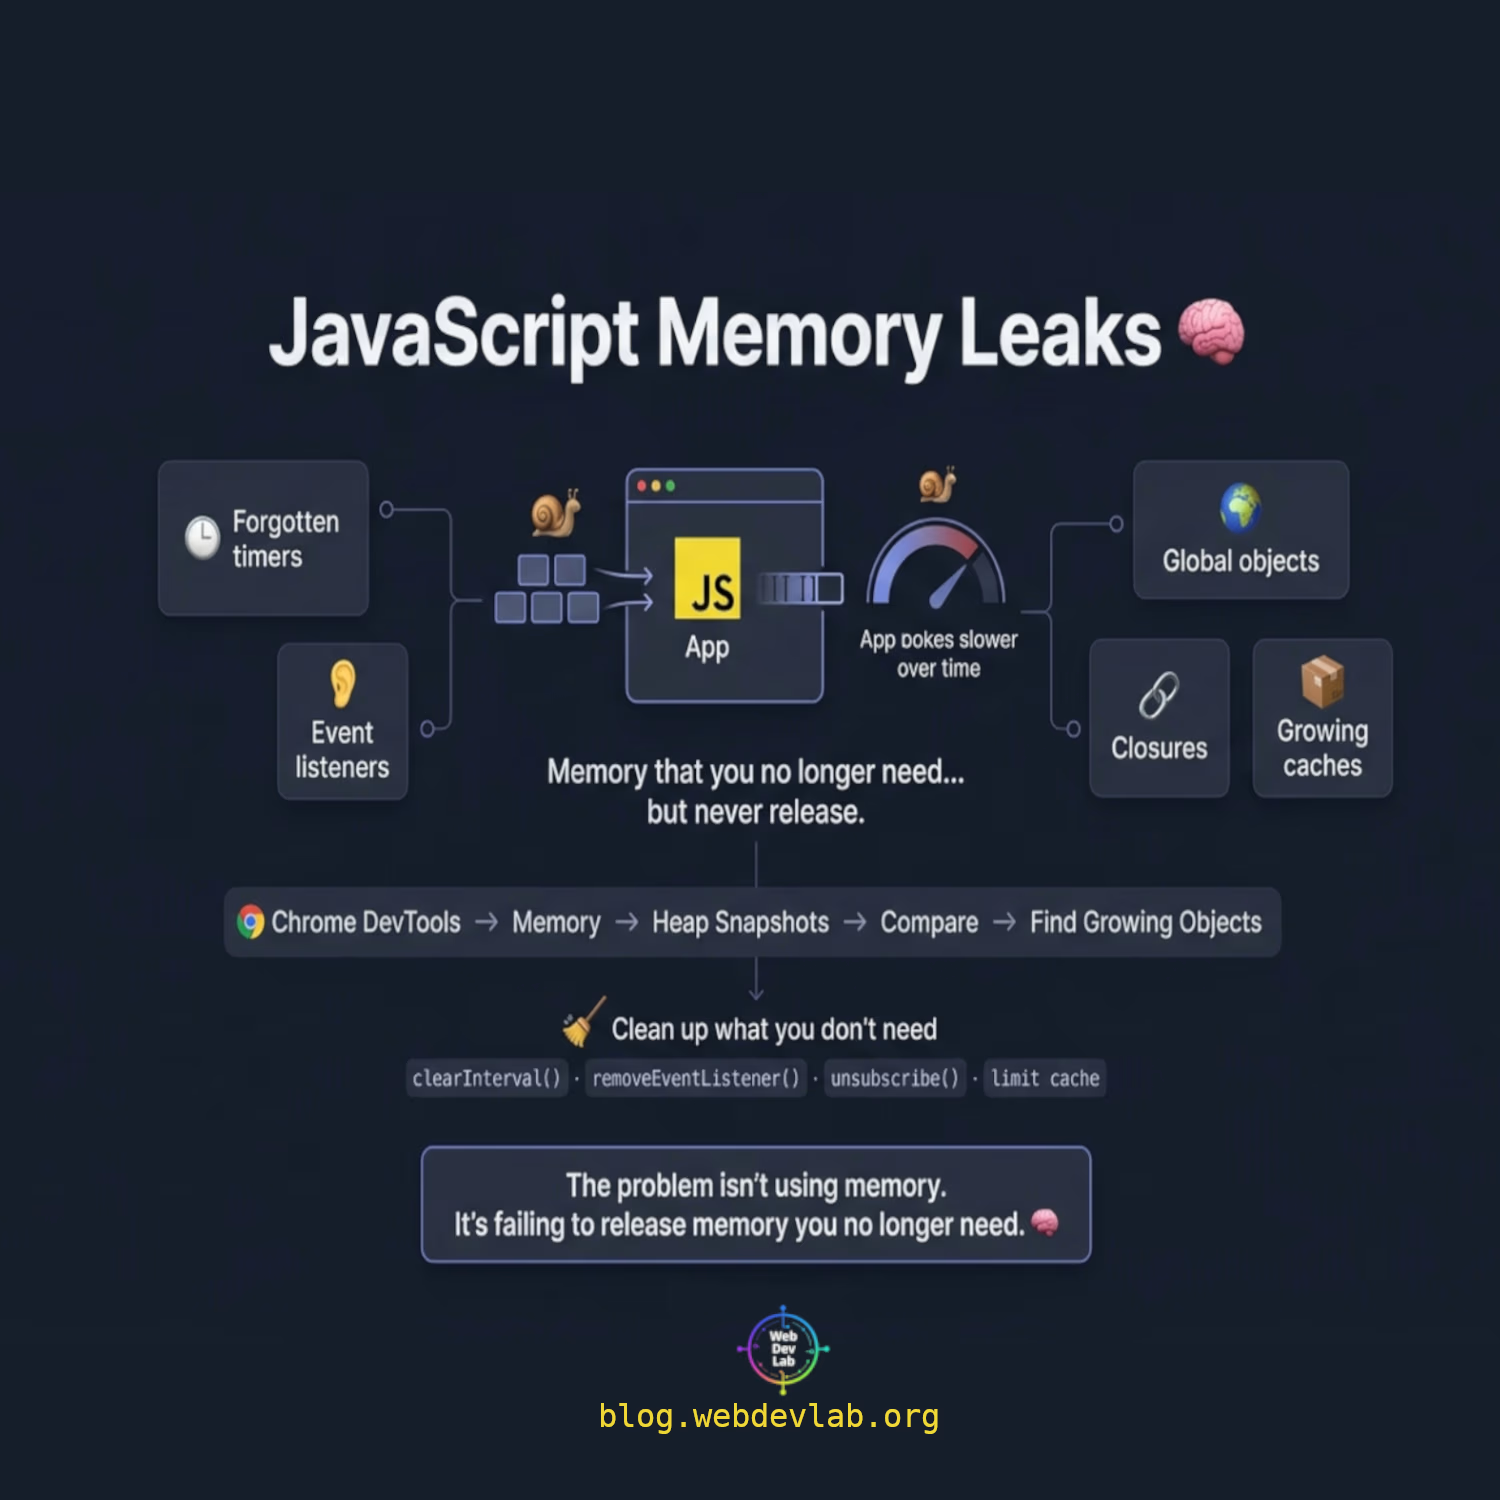
One day, your JavaScript app is fast.
A few hours later… it feels like it’s running through mud. 🐌
I’ve seen this happen because of something developers often ignore: memory leaks.
JavaScript has a Garbage Collector, but it can’t clean memory that your app still references.
Common causes? 👇
🔹 Forgotten setInterval() / setTimeout()
🔹 Event listeners that are never removed
🔹 Large objects accidentally kept in global scope
🔹 Closures holding references longer than expected
🔹 Caches that grow forever
The fix usually starts with finding what is still being referenced.
🛠️ Use Chrome DevTools → Memory → take heap snapshots → compare them → find objects that keep growing.
Then clean up what you no longer need:
clearInterval(), removeEventListener(), unsubscribe from listeners, and limit cache sizes.
The biggest lesson?
Memory leaks aren't always about using too much memory. They're about failing to release memory you no longer need. 🧠
I wrote more web development content here: blog.webdevlab.org
Have you ever spent hours debugging a slow JavaScript app only to discover a memory leak? 😅
#JavaScript #WebDevelopment #NodeJS #Programming #SoftwareEngineering
The network for creativity
Join 1.25M professional creatives like you
Connect with clients, get discovered, and run your business 100% commission-free
Creatives on Contra have earned over $150M and we are just getting started
Trending
retrofuturism
Share your favorite designs from the past exploring the distant future. Or your own take on the aesthetic 🚀
halftone
Dots. Texture. Grain. Let's see your designs using the halftone technique.

Midjourney
Creatives are showing off what they're making with Midjourney.
colorgrade
Video editors sound off: How do you enhance the mood of your video in color grading?
Related posts

Transforming local businesses into modern digital brands 🏎️✨
Designed & developed by Usman DevHub Tech & Creative Studio.
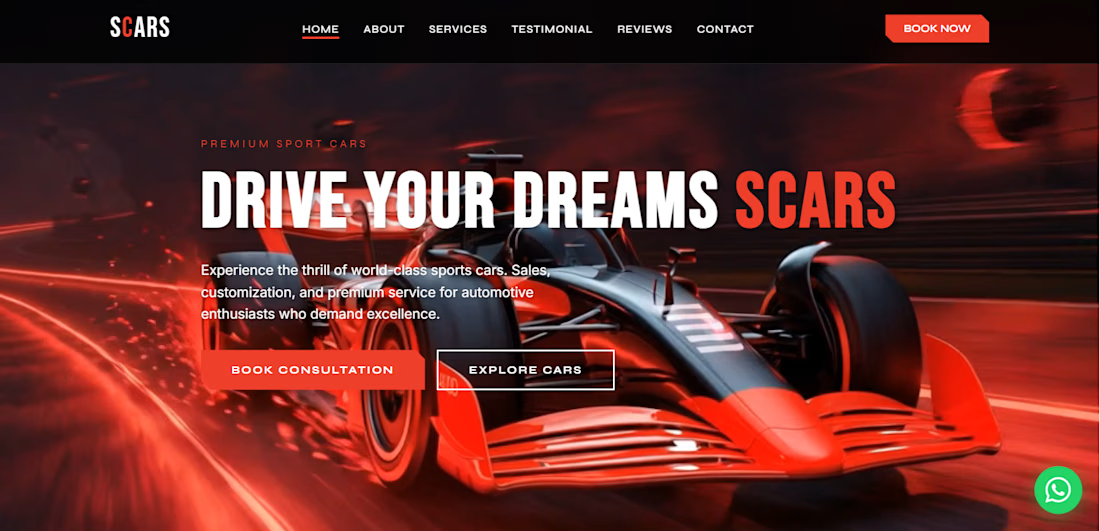
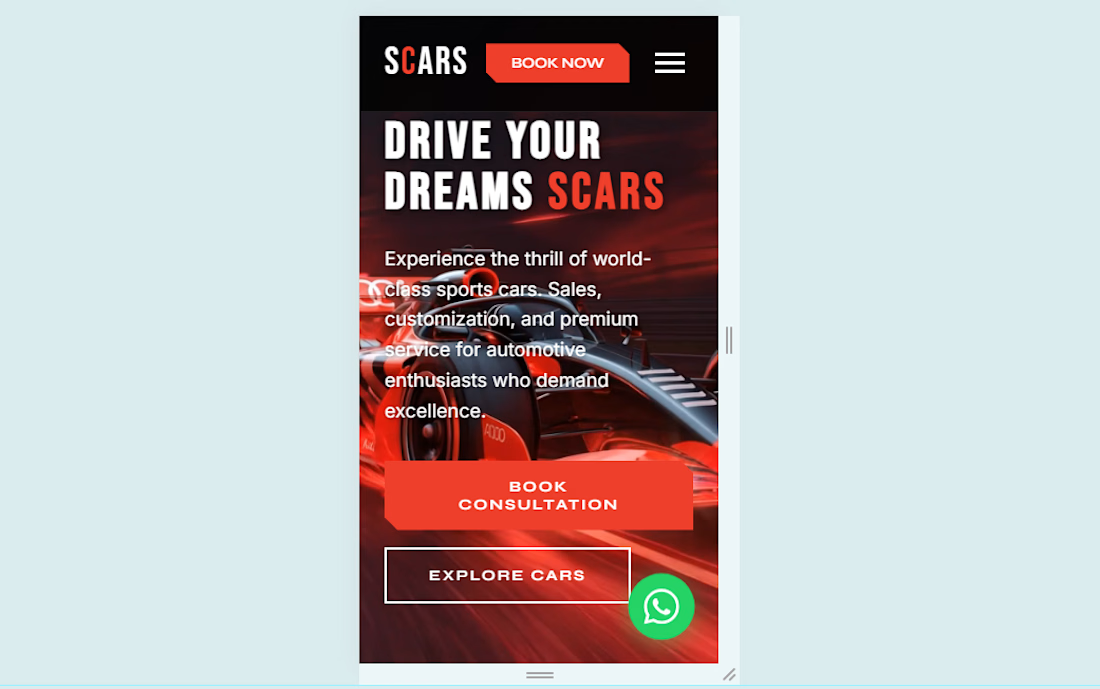
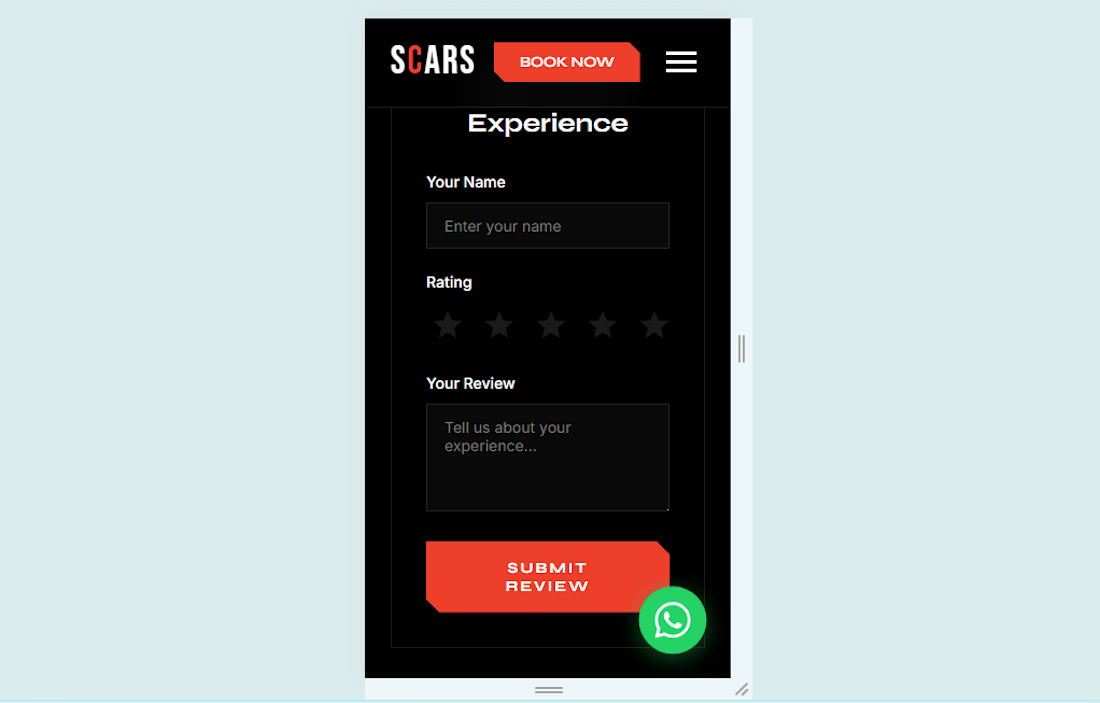
Here is a quick look at our latest landing page build for SCARS—featuring a luxury dark mode UI, smooth mobile navigation, and conversion-focused design elements!
🔗 Live Demo: https://www-scars.netlify.app
✨ Modern Website Design
✨ Luxury Dark Theme UI/UX
✨ Responsive Mobile Layout
✨ Direct WhatsApp Integration
Want a premium website like this for your business?
📩 DM us and let's discuss your project.
#WebDevelopment #WebsiteDesign #UIDesign #WebAnimation #usmandevhub




Nice work


the download button on this site does a bit of thinking.
desktop visitors get a qr modal; mobile visitors get os detection & a straight route to their store.
we tried to go for zero decisions on the user's side; the button figures it out :)


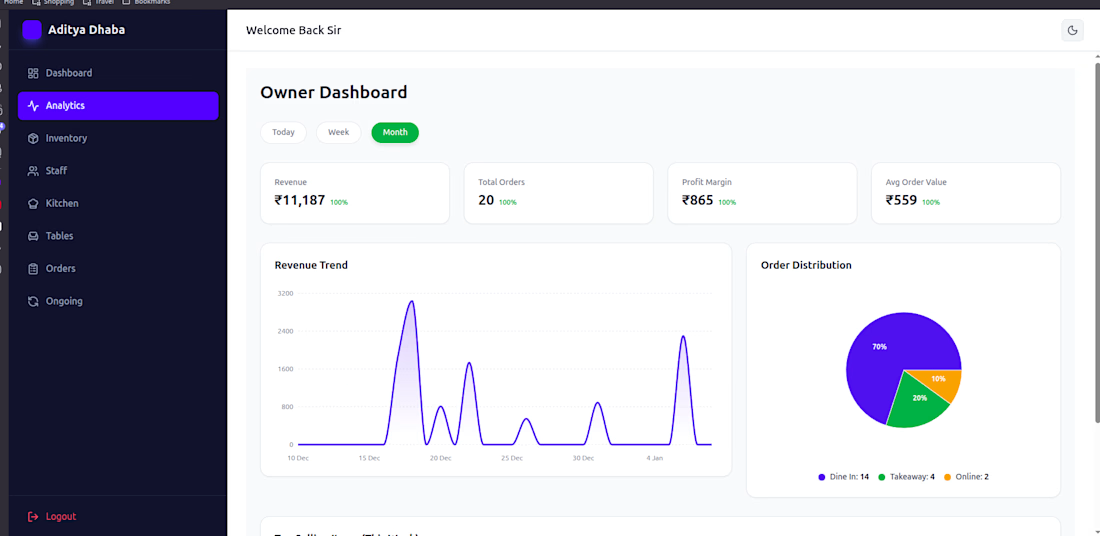
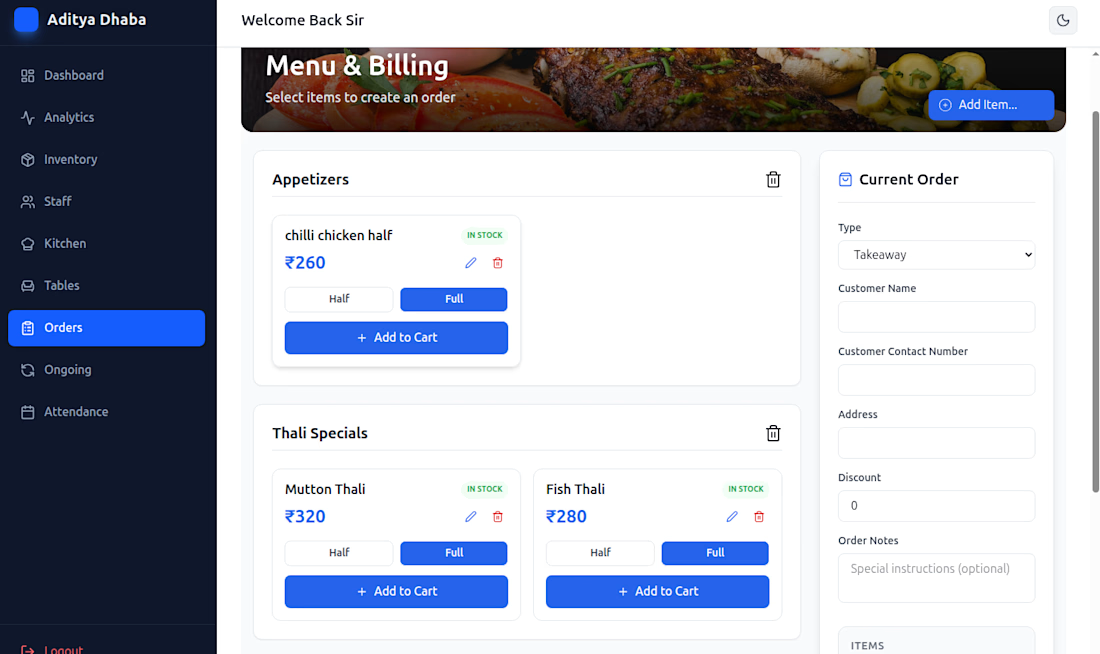
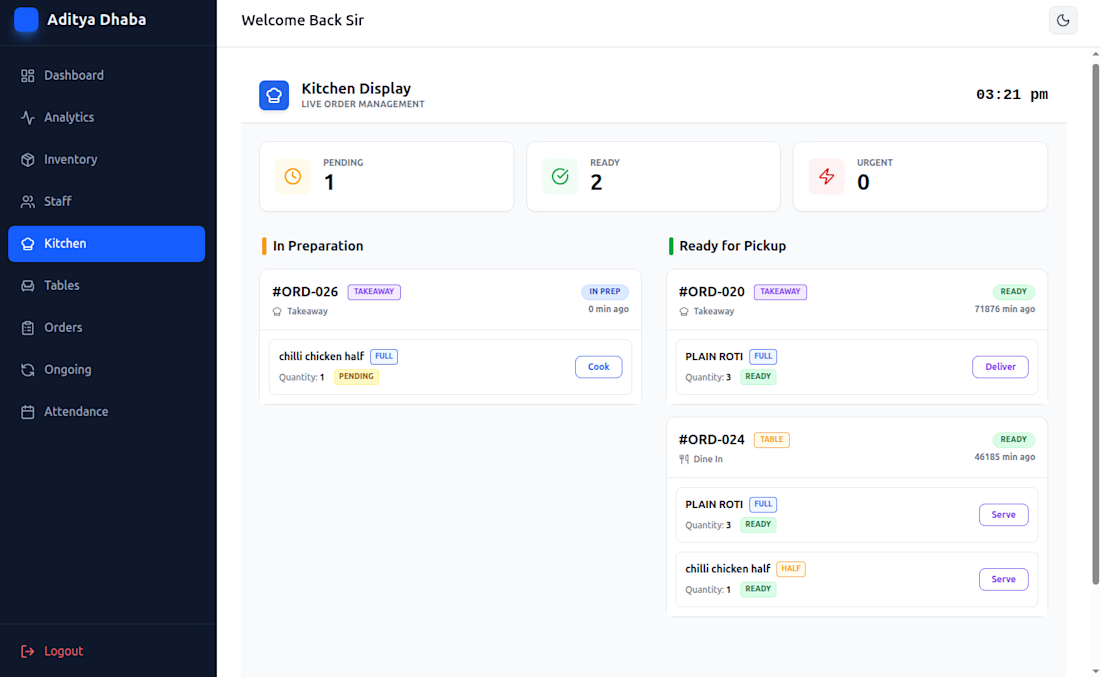
Built a Full-Stack Restaurant Management System (MERN) from scratch
Efficient order routing and inventory tracking are make-or-break for fast-paced food service operations. I built this full-stack system designed to handle real-time kitchen workflows, table seating management, and stock visibility in a single unified dashboard.
Key Capabilities:
• Live Order Tracking: Real-time state updates across front-of-house and kitchen displays.
• Seating & Table Management: Dynamic status toggles for active and reserved dining areas.
• Inventory & Stock Alerts: Automated logging to track item usage and prevent stockouts.
• Role-Based Permissions: Multi-user authentication (Admin, Staff, Kitchen) powered by secure JWT handling.
Tech Stack:
React.js • Tailwind CSS • Node.js • Express • MongoDB • REST APIs
Need a custom MERN dashboard, API integration, or Figma design converted into responsive, production-ready React code?
😊 Need a full-stack dashboard or React bug fix? Check out my 'Full-Stack MERN Development' service under the Services tab above, or send an inquiry directly!
Drop a comment or send an inquiry directly on my profile—let's build your next feature!



Impressive full-stack build; bringing orders, inventory, and kitchen operations into one dashboard makes the workflow feel much more efficient.