The network for creativity
Join 1.25M professional creatives like you
Connect with clients, get discovered, and run your business 100% commission-free
Creatives on Contra have earned over $150M and we are just getting started
Back to feedPost

Retail Pulse is a comprehensive, 12-page interactive business intelligence solution built from scratch in Power BI. Designed to analyze a robust dataset of over 100,000 retail transaction records, this project transforms raw operational data into actionable strategic insights for executive decision-making.
The dashboards maintain a strict, professional visual hierarchy—utilizing a dark-themed canvas, strict conditional color logic (Green for Revenue, Blue for Profit), and dynamic cross-filtering to allow users to isolate performance by region, time, product, and customer cohort.
🛠️ Tech Stack & Tools
Data Visualization & BI: Power BI
Data Transformation: Power Query
Calculations & Measures: DAX (Data Analysis Expressions)
Complementary Skills: Python, SQL (Data Extraction & Validation)
📈 Key Dashboards & Features
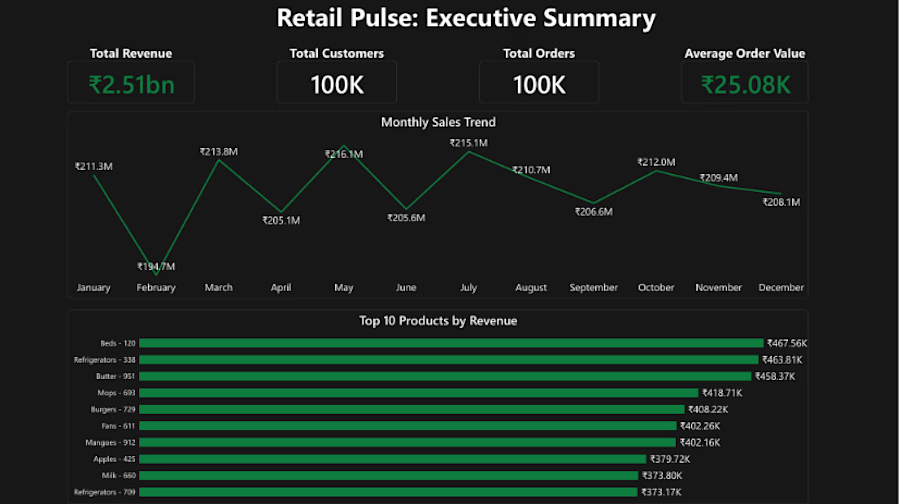
Executive Summary: High-level overview of total business health (₹2.51B Total Revenue, 100K Total Customers).
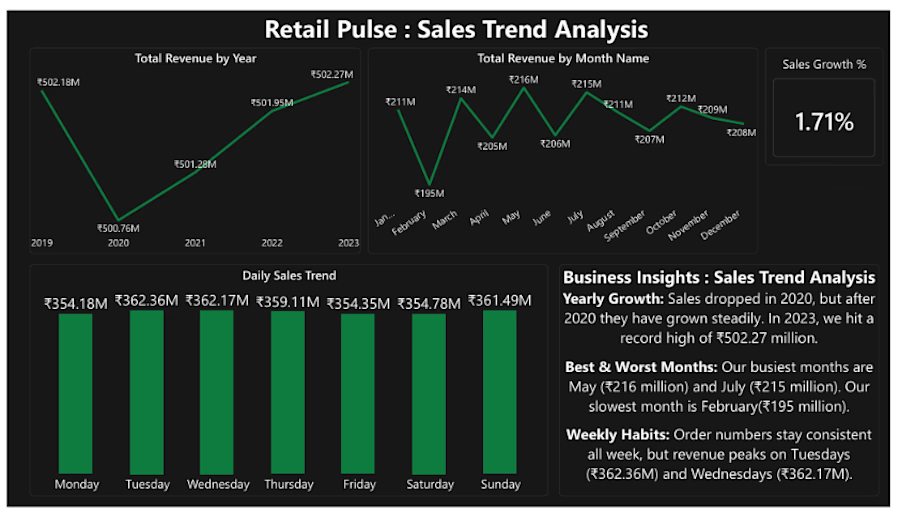
Sales & Trend Analysis: Multi-year revenue growth tracking and seasonal peak identification.
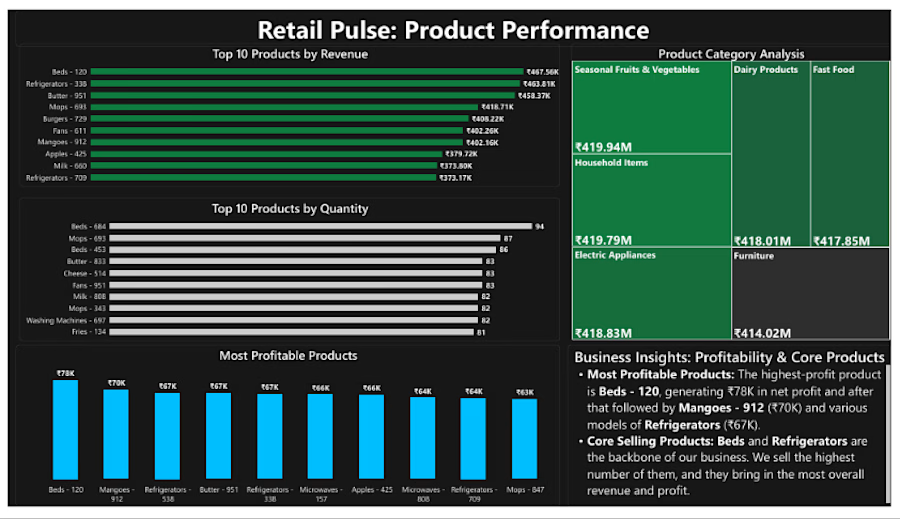
Product Performance: Profitability mapping to isolate core revenue-driving inventory (e.g., Beds & Refrigerators).
Customer Analytics: High-value segmentation and geographic performance mapping across India.
Inventory Risk: Supply chain vulnerability tracking to identify high flight-risk stockouts.
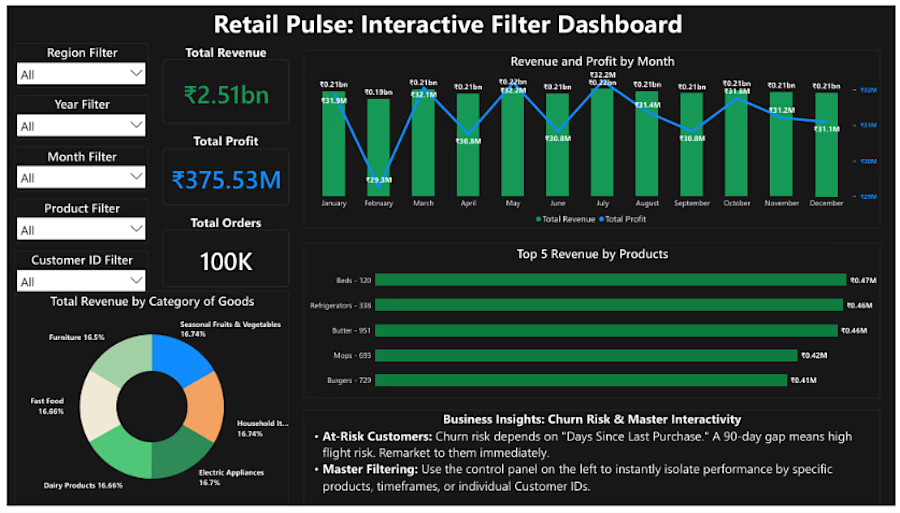
Master Interactive Filter: A dedicated control panel allowing global cross-filtering across all 12 pages via Sync Slicers.
💡 Business Insights Generated
Customer Retention: Identified a 100% repeat customer rate, alongside a strict 90-day churn risk threshold.
Profit Efficiency: While May generates the highest gross volume, July yields the highest net profit margin due to optimized product mixes.
Regional Equality: Proven market penetration with revenue split almost evenly across Tier 1, Tier 2, and Village demographics.


The network for creativity
Join 1.25M professional creatives like you
Connect with clients, get discovered, and run your business 100% commission-free
Creatives on Contra have earned over $150M and we are just getting started
Trending
retrofuturism
Share your favorite designs from the past exploring the distant future. Or your own take on the aesthetic 🚀
halftone
Dots. Texture. Grain. Let's see your designs using the halftone technique.

Midjourney
Creatives are showing off what they're making with Midjourney.
colorgrade
Video editors sound off: How do you enhance the mood of your video in color grading?





Related posts

Here are some slides from an analytics project I've been working on.

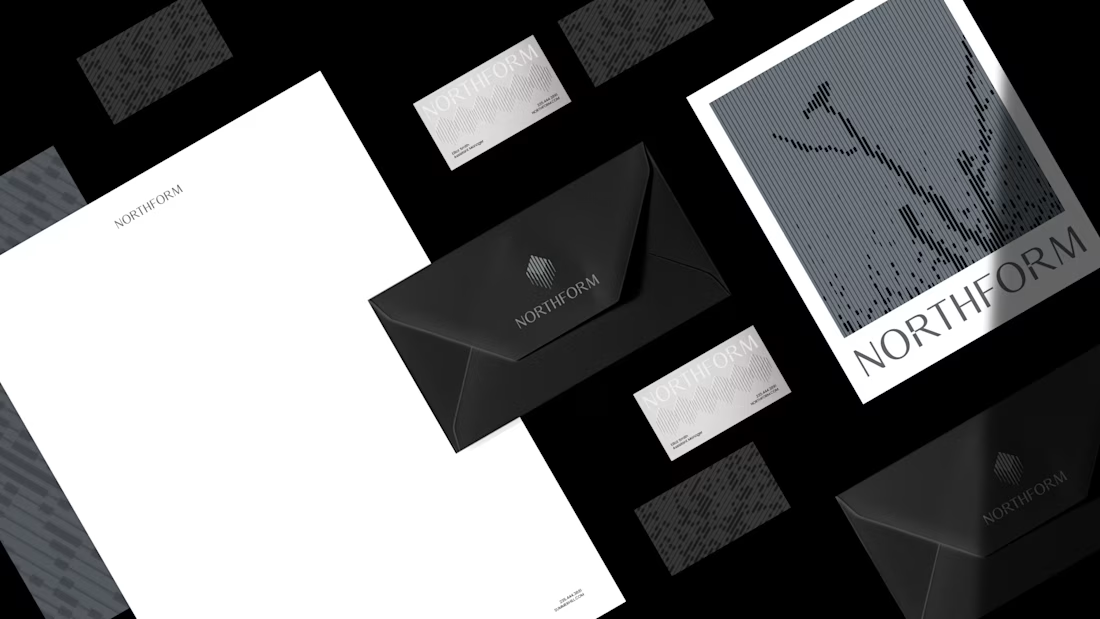

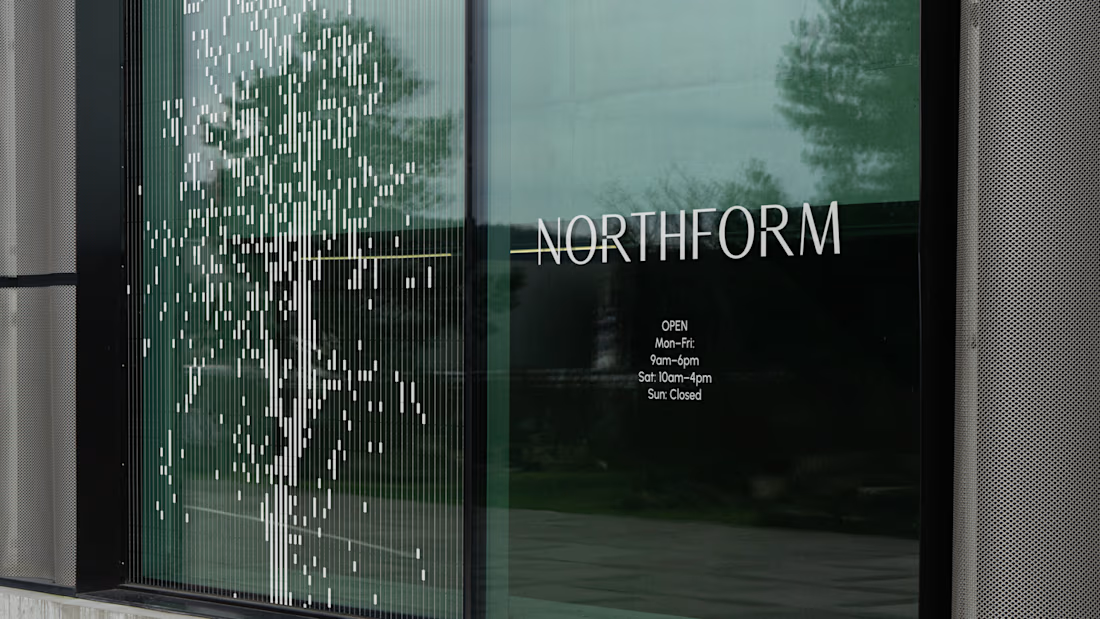
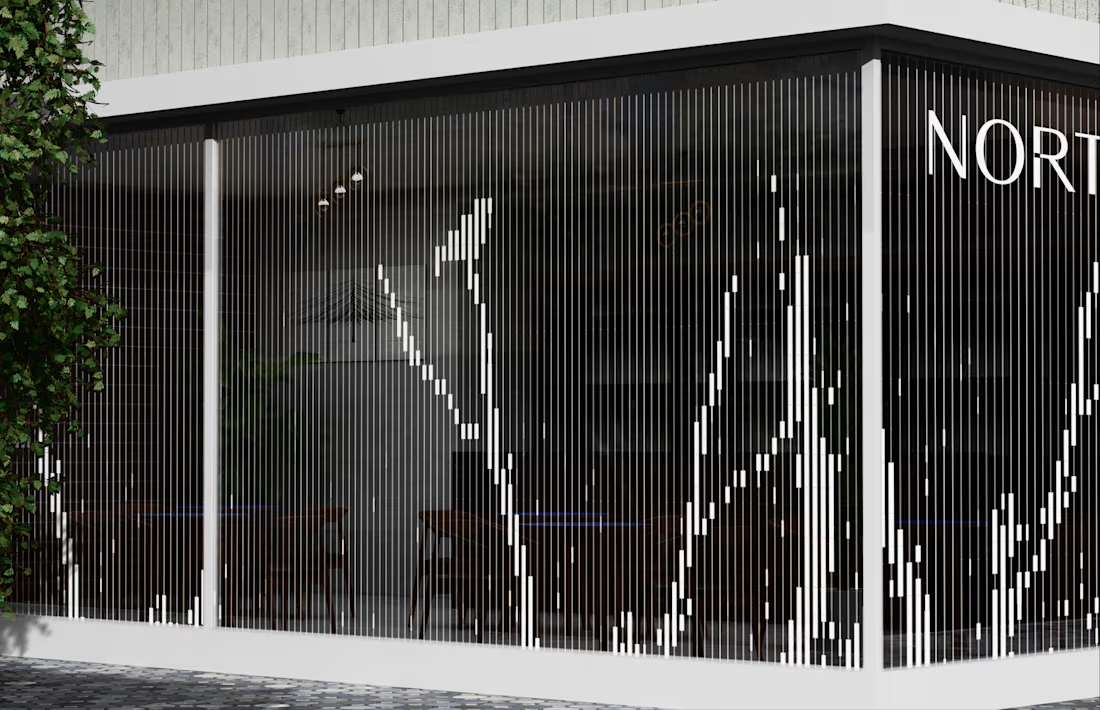


Monochrome approach looks amazing!

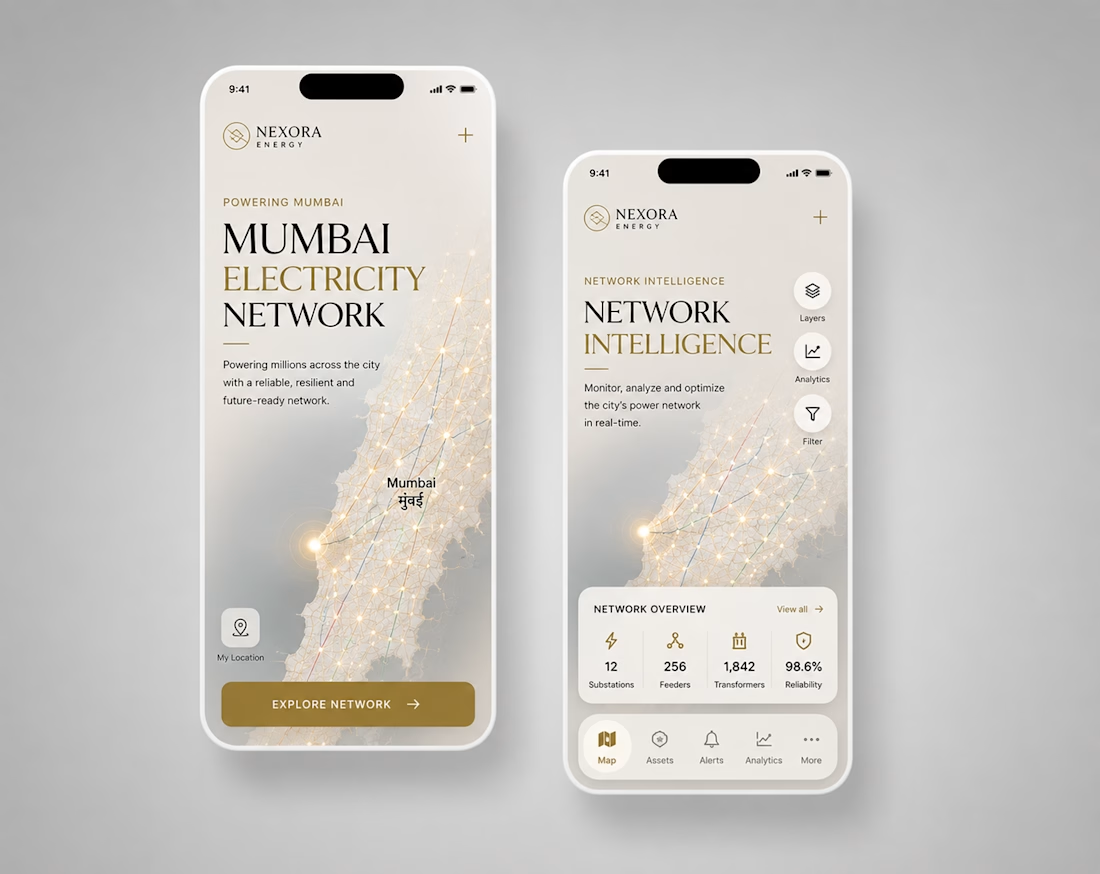
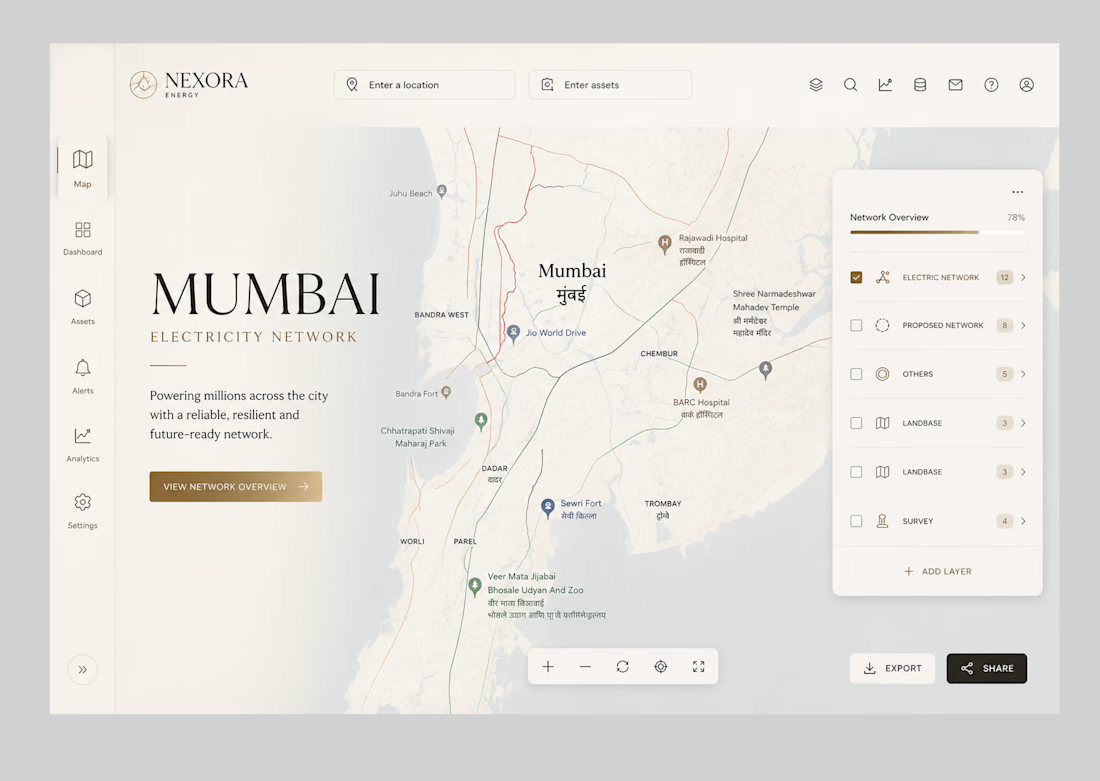
Designed a smarter way to understand complex energy networks.
A UX/UI and product design exploration for Adani Electricity, bringing network mapping, infrastructure data, alerts and analytics into a clearer experience across mobile and web.
A project focused on enterprise UX, data visualization and scalable product thinking.
Open to product design collaborations and long-term design partnerships.



What if your online store could market itself? 🤖
I’ve been building an AI-powered social media automation platform that turns ecommerce products into ready-to-publish marketing content.
The workflow can:
→ Connect to an ecommerce store
→ Sync products automatically
→ Generate social media content with AI
→ Create product-focused visuals
→ Prepare posts/stories for social platforms
→ Schedule and publish content
→ Keep product marketing running with minimal manual work
The bigger idea isn’t just “AI-generated posts.”
It’s building an automated marketing workflow around the actual products in your store.
This is the kind of automation I enjoy building: connecting APIs, AI agents, ecommerce systems, content generation, and social platforms into one practical workflow.
If you're running an ecommerce business and still creating every product post manually, there’s probably a lot that can be automated.
#AIAutomation #Ecommerce #AI #MarketingAutomation #SaaS #Automation #Contra

Love this autonomous workflow! Clean execution and super practical.