The network for creativity
Join 1.25M professional creatives like you
Connect with clients, get discovered, and run your business 100% commission-free
Creatives on Contra have earned over $150M and we are just getting started
Back to feedPost
I recently developed an interactive dashboard using Power BI to analyze IPL 2025 player performance. This project focuses on transforming raw cricket data into meaningful insights through visualization and analytics.
🔍 Key Highlights of the Dashboard:
• Player-wise analysis of Runs, Wickets, Strike Rate & Economy
• Identification of Top Batsmen and Bowlers
• Interactive filters (Search Player feature 🔍)
• Visualizations including Bar Charts, Pie Charts & Scatter Plots
• KPI Cards for quick insights
💡 This project helped me strengthen my skills in:
• Data Cleaning & Preparation using Excel
• Data Modeling & Visualization using Power BI
• Creating DAX Measures for analysis
• Designing interactive and user-friendly dashboards
The network for creativity
Join 1.25M professional creatives like you
Connect with clients, get discovered, and run your business 100% commission-free
Creatives on Contra have earned over $150M and we are just getting started
Trending
Claude
Claude has entered the design space. How are you using it?
Contra University
Learn from expert creatives how to earn more using next-gen AI tools.
Brand Design
The best brand designers are on Contra. Scroll to see what's trending in brand design. What are you building?
creativeaiflow
Creative AI workflows are evolving. What tools do you use, and what are their strengths and weaknesses?
freelancerlife
Freelancer life is wins, pivots, and everything in between. What’s yours right now?
Related posts
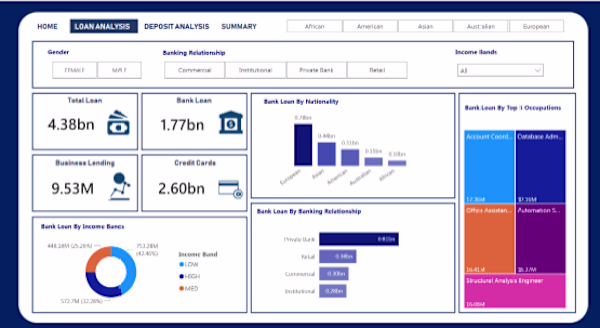
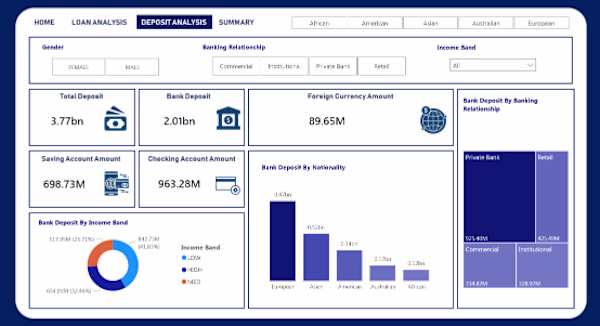
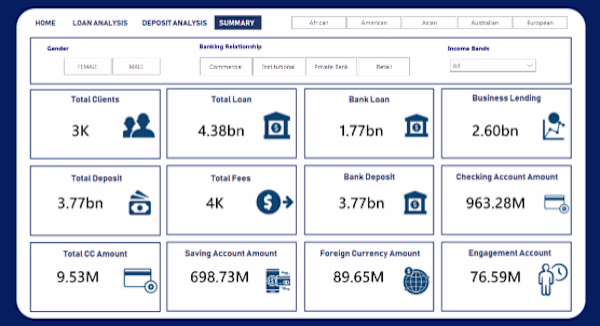
Project Title # Banking Data Analysis Dashboard Problem Statement –
Develop a basic understanding of risk analytics in banking and financial services and understand how data is used to minimise the risk of losing money while lending to customers
Solution – With our dashboards, which are created using Power BI's latest tools, it helps the company to make a decision based on the applicant’s profile, like if the applicant is likely to repay the loan, then approving the loan; otherwise, not.
📊 Tools Used
Excel (Data Cleaning) SQL (Data Processing) Python (EDA) Power BI (Dashboard)
📈 Key Insights Private banks dominate loan distribution European segment shows highest deposits Low-income customers have high loan dependency

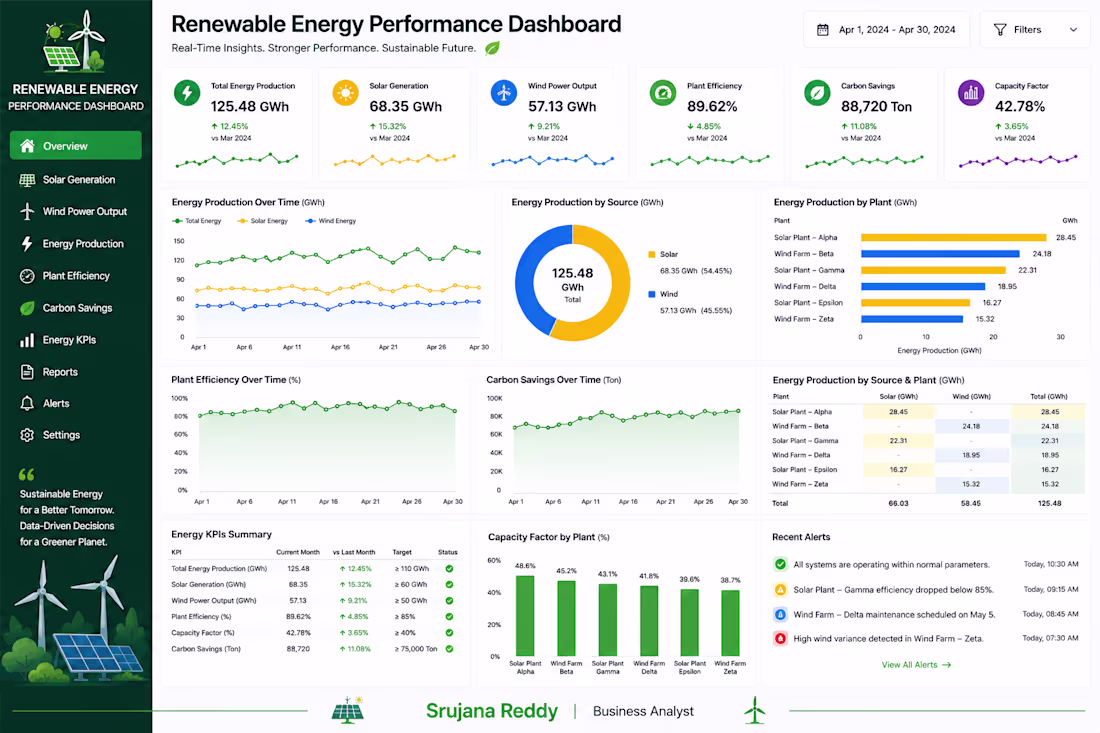
☀️ Renewable Energy Performance Dashboard
Description:
Built a professional Renewable Energy Performance Dashboard to help renewable energy companies monitor power generation, improve plant efficiency, and drive sustainable business growth through data-driven insights.
This dashboard provides a comprehensive overview of Solar Generation, Wind Power Output, Energy Production, Plant Efficiency, Carbon Savings, and Energy KPIs, enabling organizations to track renewable energy performance, optimize power generation, reduce operational losses, measure environmental impact, and support strategic decision-making.
Developed using Microsoft Power BI, SQL, and Microsoft Excel, the dashboard features executive-level KPI cards, interactive visualizations, trend analysis, plant performance monitoring, carbon reduction metrics, and drill-down reports. It transforms complex energy data into actionable business intelligence, empowering organizations to maximize operational efficiency while achieving sustainability goals.
Key Features
☀️ Solar Energy Generation Analysis
🌬️ Wind Power Output Monitoring
⚡ Energy Production & Plant Efficiency Tracking
🌱 Carbon Savings & Sustainability Reporting
📈 Renewable Energy KPI Monitoring
📊 Executive Dashboard with Interactive Reports
Client Note
Looking for a customized Renewable Energy Performance Dashboard tailored to your business? I design modern, interactive, and executive-level Business Intelligence dashboards that convert complex renewable energy data into clear, actionable insights. Every dashboard is customized to your operational goals, helping you monitor energy production, improve plant performance, track sustainability initiatives, optimize resource utilization, and support data-driven decision-making. If you're looking for a high-quality, professional dashboard that combines outstanding visual design with measurable business value, I'd be happy to discuss your requirements and deliver a solution tailored to your organization's needs.
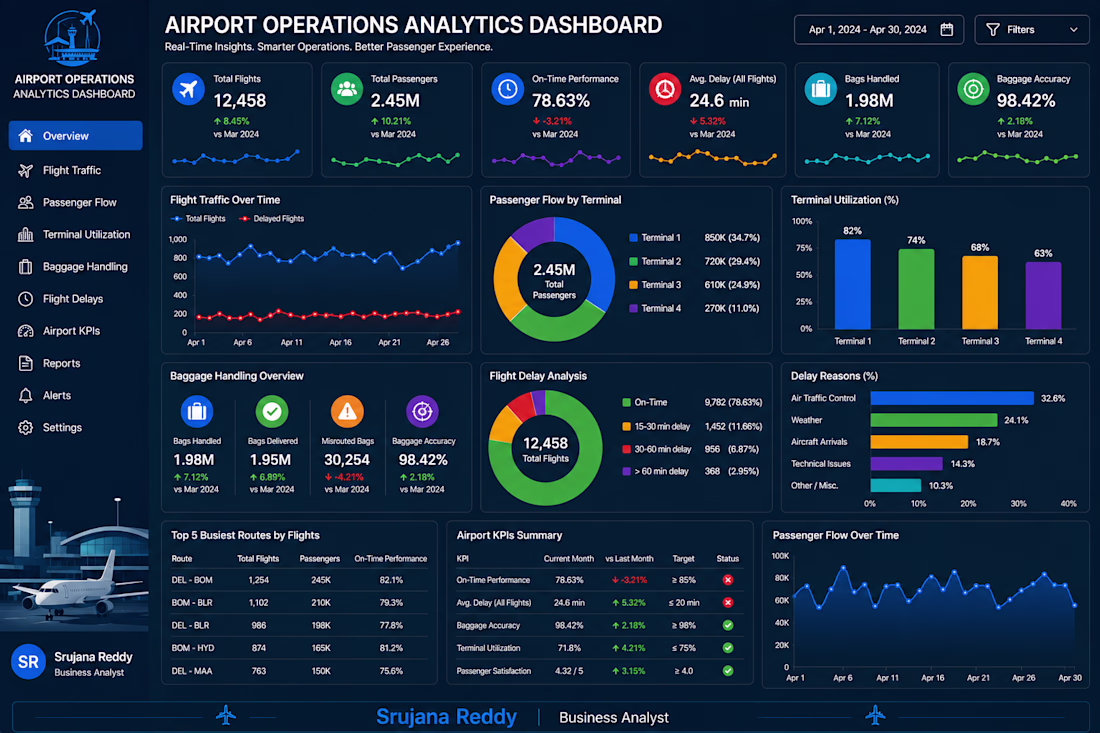
✈️ Airport Operations Analytics Dashboard
Description:
Built a professional Airport Operations Analytics Dashboard to help airports, airlines, and aviation authorities monitor operational performance, improve passenger experience, and optimize airport resource utilization through data-driven insights.
This dashboard provides a comprehensive overview of Flight Traffic, Passenger Flow, Terminal Utilization, Baggage Handling, Flight Delay Analysis, and Airport KPIs, enabling stakeholders to monitor airport efficiency, identify operational bottlenecks, improve on-time performance, optimize terminal capacity, and enhance overall airport operations.
Developed using Microsoft Power BI, SQL, and Microsoft Excel, the dashboard features executive-level KPI cards, interactive visualizations, operational trend analysis, real-time performance monitoring, and drill-down reports. It transforms complex aviation data into actionable business intelligence, helping decision-makers improve operational efficiency, reduce delays, and deliver a seamless passenger experience.
Key Features
✈️ Flight Traffic & Air Traffic Analysis
👥 Passenger Flow & Terminal Utilization Monitoring
🧳 Baggage Handling Performance Tracking
⏱️ Flight Delay Analysis & On-Time Performance
📈 Airport Operational KPI Monitoring
📊 Executive Dashboard with Interactive Reports
Client Note
Looking for a customized Airport Operations Analytics Dashboard tailored to your aviation business? I develop modern, interactive, and executive-level Business Intelligence dashboards that transform operational data into actionable insights. Every dashboard is customized to your business requirements, helping you optimize airport operations, monitor passenger flow, improve flight performance, reduce operational delays, and support strategic decision-making. If you're looking for a high-quality, professional dashboard that delivers measurable business value and a premium user experience, I'd be happy to discuss your project and build a solution tailored to your organization's goals.