The network for creativity
Join 1.25M professional creatives like you
Connect with clients, get discovered, and run your business 100% commission-free
Creatives on Contra have earned over $150M and we are just getting started
Back to feedPost

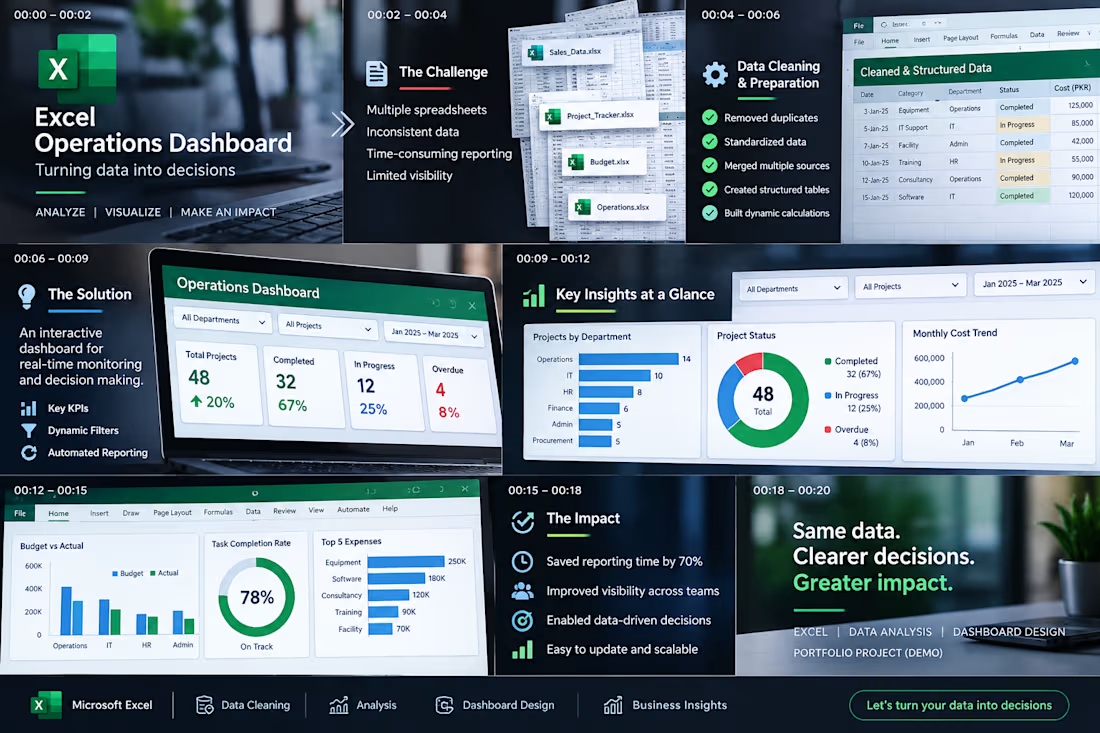
Excel Operations Dashboard — Portfolio Sample
Turning raw operational data into clear, decision-ready insights.
This portfolio project demonstrates how scattered Excel data can be cleaned, structured, analyzed, and transformed into a professional management dashboard.
Key features:
Data cleaning and standardization
Project and task tracking
KPI monitoring
Budget vs. actual analysis
Department-wise performance
Interactive filters and visual reporting
Management-focused insights
Tools: Microsoft Excel, Pivot Tables, Excel Charts & Formulas
Skills: Data Cleaning • Data Analysis • Dashboard Design • Reporting • Project Tracking • Operations Support

The network for creativity
Join 1.25M professional creatives like you
Connect with clients, get discovered, and run your business 100% commission-free
Creatives on Contra have earned over $150M and we are just getting started

Challenges
View all


Related posts


🚨 𝗦𝘁𝗶𝗹𝗹 𝘄𝗮𝗶𝘁𝗶𝗻𝗴 𝗱𝗮𝘆𝘀 𝗳𝗼𝗿 𝘆𝗼𝘂𝗿 𝗳𝗶𝗻𝗮𝗻𝗰𝗲 𝘁𝗲𝗮𝗺 𝘁𝗼 𝗰𝗼𝗻𝘀𝗼𝗹𝗶𝗱𝗮𝘁𝗲 𝘀𝗽𝗿𝗲𝗮𝗱𝘀𝗵𝗲𝗲𝘁𝘀?
If you are making strategic decisions on delayed P&L reports, you are operating with blind spots.
When managing 𝟴-𝗳𝗶𝗴𝘂𝗿𝗲 𝗿𝗲𝘃𝗲𝗻𝘂𝗲 (€𝟭𝟳.𝟳𝟳𝗠+), static spreadsheets fail to provide the real-time cost visibility needed to protect profit margins.
Here is an executive-grade 𝗣𝗼𝘄𝗲𝗿 𝗕𝗜 𝗙𝗶𝗻𝗮𝗻𝗰𝗶𝗮𝗹 & 𝗣&𝗟 𝗦𝘁𝗮𝘁𝗲𝗺𝗲𝗻𝘁 𝗗𝗮𝘀𝗵𝗯𝗼𝗮𝗿𝗱 designed for leadership to monitor profitability, control operating expenses, and optimize cash flow in seconds.
📊 𝗞𝗘𝗬 𝗙𝗜𝗡𝗔𝗡𝗖𝗜𝗔𝗟 𝗜𝗡𝗦𝗜𝗚𝗛𝗧𝗦 & 𝗜𝗠𝗣𝗔𝗖𝗧
🔹 𝗥𝗲𝘃𝗲𝗻𝘂𝗲 𝗦𝘁𝗿𝗲𝗮𝗺 𝗩𝗶𝘀𝗶𝗯𝗶𝗹𝗶𝘁𝘆: Analyzed €𝟭𝟳.𝟳𝟳𝗠 in total top-line revenue, isolating core product sales (€𝟭𝟭.𝟳𝟳𝗠) vs. consulting services (€𝟲.𝟬𝟬𝗠).
🔹 𝗠𝗮𝗿𝗴𝗶𝗻 𝗢𝗽𝘁𝗶𝗺𝗶𝘇𝗮𝘁𝗶𝗼𝗻: Automated tracking for €𝟭𝟬.𝟱𝟵𝗠 𝗚𝗿𝗼𝘀𝘀 𝗣𝗿𝗼𝗳𝗶𝘁 (𝟱𝟵.𝟲% 𝗠𝗮𝗿𝗴𝗶𝗻) and €𝟱.𝟱𝟬𝗠 𝗡𝗲𝘁 𝗣𝗿𝗼𝗳𝗶𝘁 (𝟯𝟬.𝟵% 𝗡𝗲𝘁 𝗠𝗮𝗿𝗴𝗶𝗻).
🔹 𝗖𝗼𝘀𝘁 𝗖𝗲𝗻𝘁𝗲𝗿 𝗖𝗼𝗻𝘁𝗿𝗼𝗹: Uncovered Raw Materials (€𝟲.𝟰𝟱𝗠) as 𝟴𝟵.𝟵% of total COGS, unlocking direct vendor renegotiation targets.
🔹 𝗢𝗽𝗲𝗿𝗮𝘁𝗶𝗻𝗴 𝗘𝘴𝗽𝗲𝗻𝘀𝗲 𝗧𝗿𝗮𝗰𝗸𝗶𝗻𝗴: Monitored €𝟰.𝟱𝟳𝗠 in Opex, detailing consulting overhead (€𝟮.𝟲𝟮𝗠) and R&D spend (€𝟭.𝟰𝟯𝗠).
🔹 𝗗𝘆𝗻𝗮𝗺𝗶𝗰 𝗧𝗶𝗺𝗲 𝗜𝗻𝘁𝗲𝗹𝗹𝗶𝗴𝗲𝗻𝗰𝗲: Enabled instant drill-down across Quarters, Months, and Product Lines without relying on external paid visuals.
⚡ Automating P&L reporting eliminates manual errors, cuts review prep from days to seconds, and gives C-suite stakeholders total control over their bottom line.
💬 𝗟𝗼𝗼𝗸𝗶𝗻𝗴 𝘁𝗼 𝗮𝘂𝘁𝗼𝗺𝗮𝘁𝗲 𝘆𝗼𝘂𝗿 𝗳𝗶𝗻𝗮𝗻𝗰𝗶𝗮𝗹 𝗿𝗲𝗽𝗼𝗿𝘁𝗶𝗻𝗴 𝗼𝗿 𝗻𝗲𝗲𝗱 𝗮 𝗰𝘂𝘀𝘁𝗼𝗺 𝗣𝗼𝘄𝗲𝗿 𝗕𝗜 𝗱𝗮𝘀𝗵𝗯𝗼𝗮𝗿𝗱?
📩 𝗛𝗶𝗿𝗶𝗻𝗴 𝗮 𝗗𝗮𝘁𝗮 𝗔𝗻𝗮𝗹𝘆𝘀𝘁 / 𝗕𝗜 𝗗𝗲𝘃𝗲𝗹𝗼𝗽𝗲𝗿 for your team or project?
Send me a DM or let’s connect!
#PowerBI #FinancialAnalytics #BusinessIntelligence #ProfitAndLoss #ExecutiveDashboard #DataVisualization #FinancialModeling #DAX #CFOInsights #CorporateFinance
#BangladeshBusiness #CorporateBD #DhakaJobs #DataAnalystBD #TechBangladesh #BIFreelancer #DhakaStartups #BangladeshTech


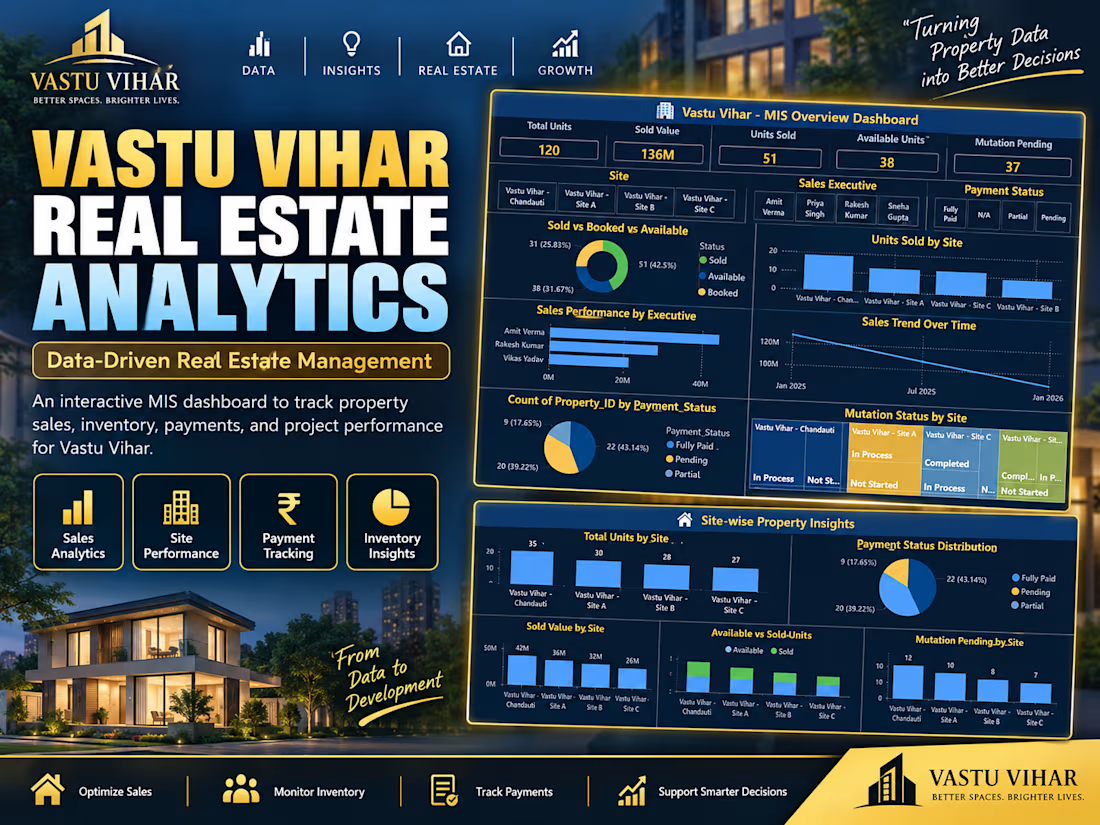
Turning property data into better decisions 🏠📊 Built a full MIS dashboard for a real estate business — tracking 120 units across 4 sites, ₹13.6Cr in sales, payment status, and mutation progress, all in one Power BI view. Excel + Power BI + data modeling. #DataAnalytics #PowerBI #RealEstateAnalytics #Excel #DashboardDesign