The network for creativity
Join 1.25M professional creatives like you
Connect with clients, get discovered, and run your business 100% commission-free
Creatives on Contra have earned over $150M and we are just getting started
Back to feedPost
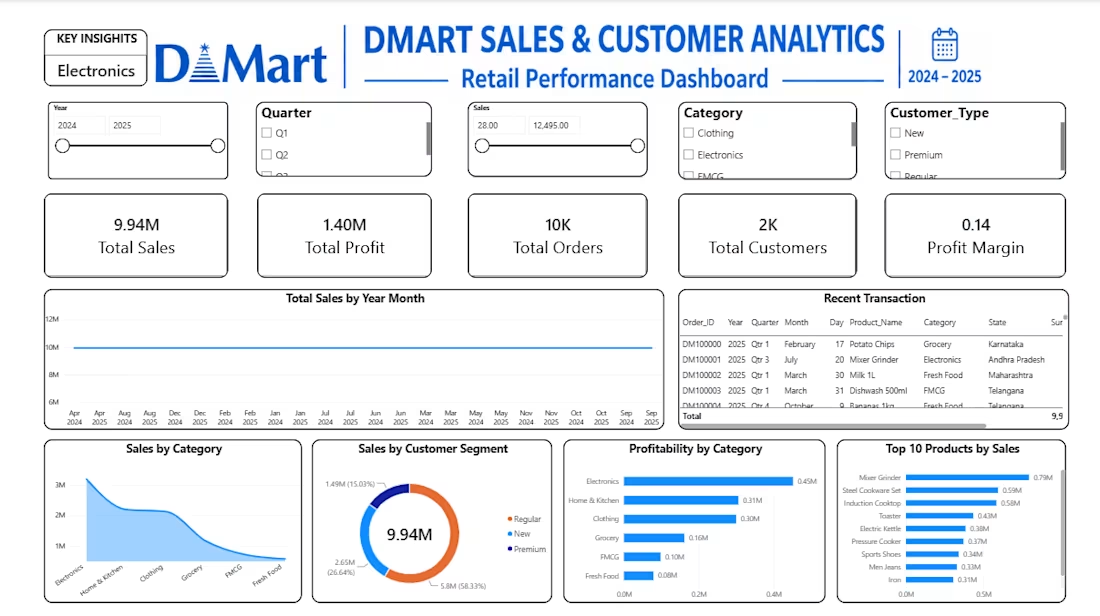
DMart Sales & Customer Analytics Dashboard
Overview
Developed an interactive Power BI dashboard to analyze retail sales, profitability, customer behaviour, product performance, and store-level performance using a 9,994-row DMart-style retail dataset.
Key Analysis
Sales and profit performance across time
Category and sub-category performance
Top-selling products
Customer segmentation and demographics
Payment method analysis
State, city, and store performance
Discount and profitability analysis
Customer rating analysis
Tools & Technologies
Power BI
DAX
Microsoft Excel
Data Cleaning
Data Modeling
Data Visualization
Key Power BI Features
Interactive slicers
KPI cards
Time-series analysis
Drill-down analysis
Conditional formatting
Dynamic DAX measures
Interactive page navigation
Tooltips
Date-table based time intelligence
Business Objective
The dashboard provides a consolidated view of retail performance and enables users to explore sales, profitability, customer behaviour, and geographic performance through interactive visualizations.


The network for creativity
Join 1.25M professional creatives like you
Connect with clients, get discovered, and run your business 100% commission-free
Creatives on Contra have earned over $150M and we are just getting started





Related posts

I Created Microsoft Power BI Dashboard By using many of the Tools
🚀 Data Modelling
🧠 Data Visualization
🚀 Group By
🧠 Data Cleaning


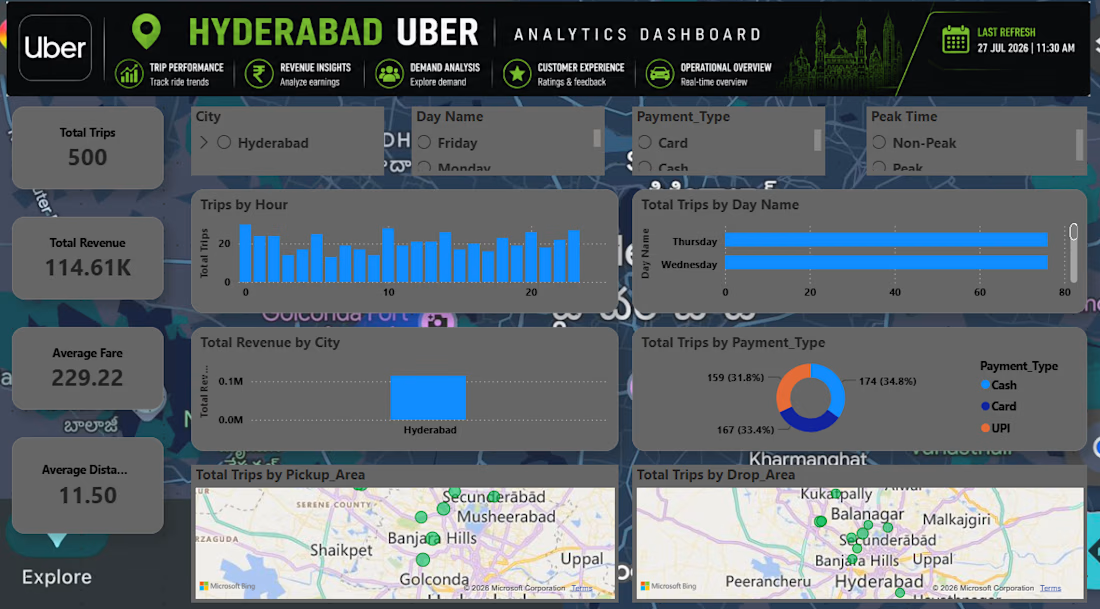
“I developed an Uber Analytics Dashboard using Power BI to analyze trip performance, revenue, demand, customer experience, and operational trends. I worked on data cleaning and transformation using Power Query, created DAX measures and KPIs, and designed interactive visuals for trips by hour/day, revenue, payment types, pickup and drop areas, average fare, and distance. The dashboard helps identify peak demand periods, revenue patterns, popular areas, and customer payment preferences for better business decision-making.”