The network for creativity
Join 1.25M professional creatives like you
Connect with clients, get discovered, and run your business 100% commission-free
Creatives on Contra have earned over $150M and we are just getting started
Back to feedPost

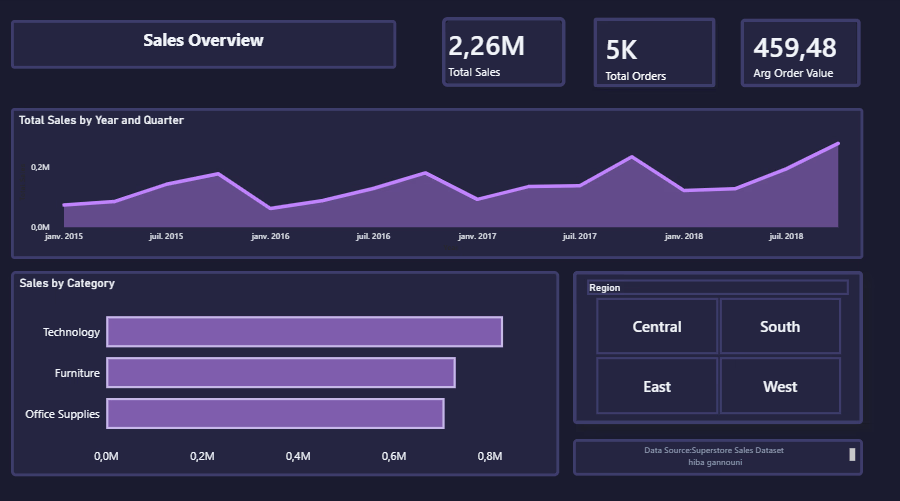
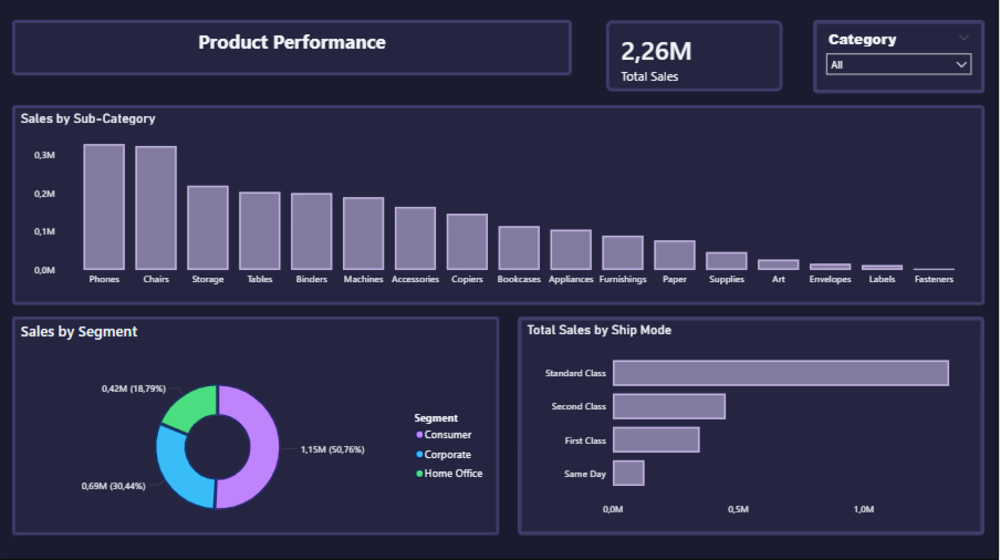
Superstore Sales Performance Dashboard: Retail sales analysis for a US-based ecommerce business covering 4 years of transactional data across 3 product categories, 4 regions, and 17 product sub-categories. Business Problem:
Which products, regions, and customer segments are driving revenue and where are the gaps?
Key Findings:
•Technology is the top revenue category, generating the highest sales across all regions.
•The Consumer segment accounts for 51% of total revenue, outperforming Corporate and Home Office.
•Standard Class shipping dominates fulfillment, representing the majority of all orders
Dashboard Details.
•Covering overall sales performance and detailed product breakdown.
•Interactive filters by region and product category.
•Visuals include revenue trends, sales by sub-category, segment distribution, and shipping analysis.


The network for creativity
Join 1.25M professional creatives like you
Connect with clients, get discovered, and run your business 100% commission-free
Creatives on Contra have earned over $150M and we are just getting started
Trending
retrofuturism
Share your favorite designs from the past exploring the distant future. Or your own take on the aesthetic 🚀
halftone
Dots. Texture. Grain. Let's see your designs using the halftone technique.

Midjourney
Creatives are showing off what they're making with Midjourney.
colorgrade
Video editors sound off: How do you enhance the mood of your video in color grading?
Challenges
View all


Related posts

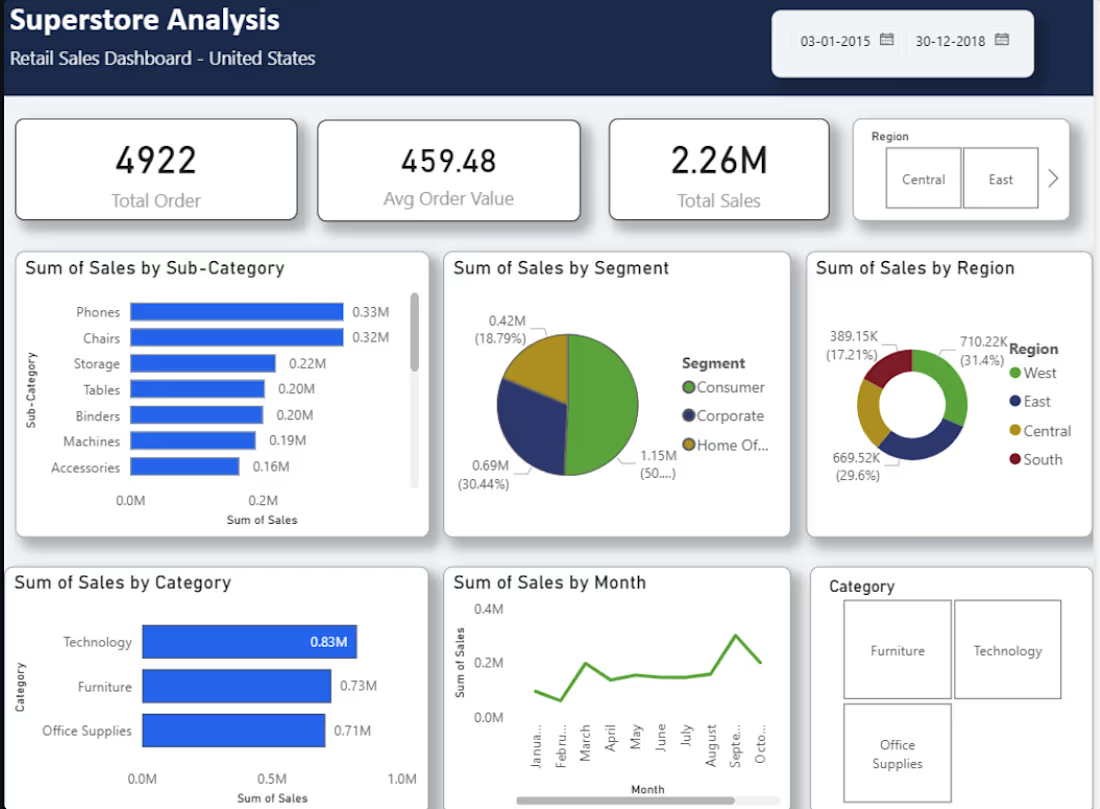
A live interactive Sales Analytics Dashboard built in Power BI Desktop using the Superstore retail dataset.


Most reporting problems don’t start with the dashboard.
They start with the data behind it.
Before I build a Power BI or Excel report, I usually check three things first:
• inconsistent categories and naming
• manual steps that can be automated
• KPIs being calculated differently across reports
Fixing these first usually makes the final dashboard simpler, more reliable and much easier to maintain.
Good reporting is not just about making charts look better.
It’s about creating numbers people can actually trust.

Thrilled to share that I have officially completed the training program at Manara!
Throughout this journey, I’ve deeply enhanced my technical skills in data and machine learning, working through rigorous projects and sharpening my expertise in building scalable, real-world solutions.
A huge thank you to the entire Manara team and mentors for the incredible guidance and support. This is a solid milestone, and I’m super excited for the next chapter—gearing up for the AWS Certified Machine Learning Engineer exam and diving deeper into MLOps!
#Manara #MachineLearning #DataEngineering #MLOps #AWS #ContinuousLearning




Huge congratulations, Hazem! Such a great milestone😊