The network for creativity
Join 1.25M professional creatives like you
Connect with clients, get discovered, and run your business 100% commission-free
Creatives on Contra have earned over $150M and we are just getting started
Back to feedPost

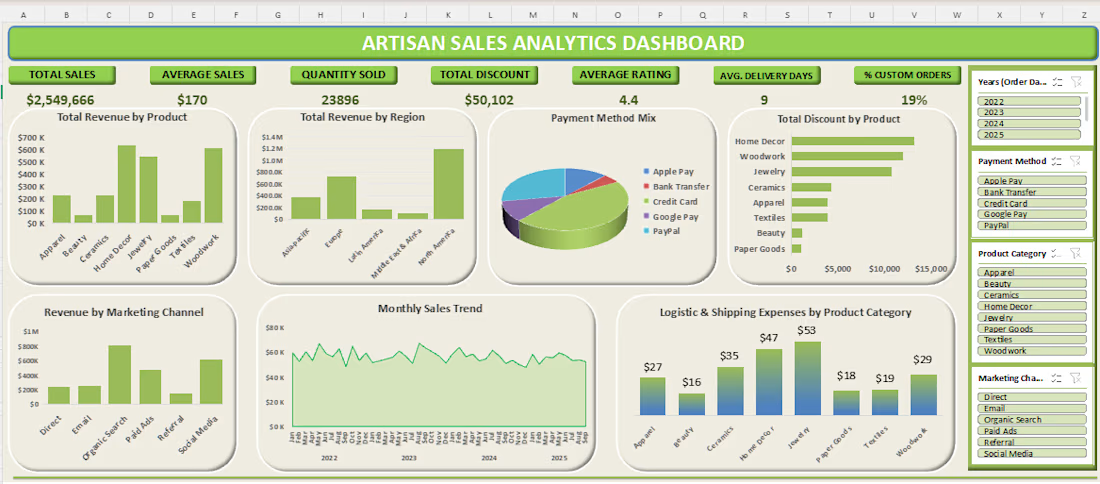
Transformed unorganized transactional sales data into an interactive, high-level executive dashboard to track revenue drivers, regional performance, shipping overhead, and marketing efficiency.
Key Achievements & Business Value Delivered
Centralized Core Metrics: Built interactive KPI cards tracking $2.55M total sales, 23.8k units sold, $50.1k discounts, and an average customer satisfaction rating of 4.4/5.
Regional & Channel Attribution: Identified North America and Europe as primary revenue drivers while analyzing sales across 6 marketing channels (Organic Search, Social Media, Direct, Paid Ads, Referral, Email).
Shipping & Overhead Analysis: Visualized logistics costs per product category, pinpointing higher shipping expenses in Jewelry ($53) and Home Decor ($47) to highlight cost-saving opportunities.
Dynamic Slicing: Integrated multi-parameter dynamic slicers (Year, Payment Method, Product Category, Marketing Channel) for instant data filtering and drill-down analysis.
Technical Workflow & Execution
Data Cleaning & Transformation (Excel / Spreadsheet Processing)
Analytical Modeling
Visual Dashboard Design
Tools Used: Microsoft Excel (Data Cleaning, Data Modeling, Dynamic Slicers, Dashboard Design, Pivot Table); Data Visualization (KPI Cards, Bar Charts, Line Graphs, Pie Charts).
Assets Included: Dynamic Excel Dashboard File, Cleaned Raw Data Set, Visual Project Documentation


The network for creativity
Join 1.25M professional creatives like you
Connect with clients, get discovered, and run your business 100% commission-free
Creatives on Contra have earned over $150M and we are just getting started





Related posts


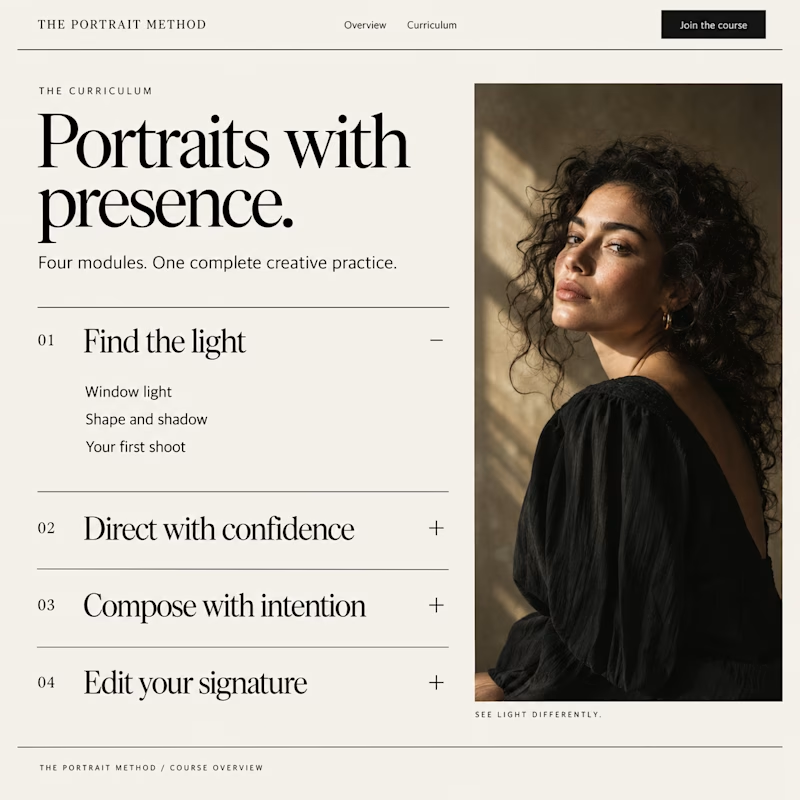
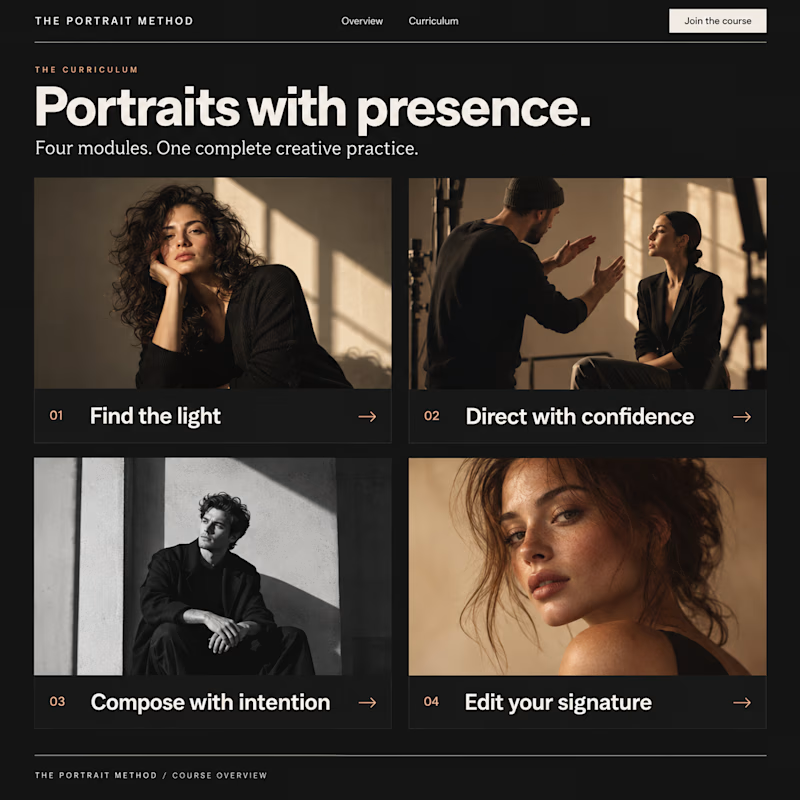
Which Kajabi course outline makes you want to enroll?
Same course. Two directions: a clean accordion or visual module cards.
Vote below. What tipped the scale for you?

10 voted
33%
20 voted
67%
30 votes
Closed

Visual module cards win every time for user engagement—they give buyers an immediate sense of structural depth before they even enroll.

Sky is the limit? I just tried Opus 5.5 for the first time, and honestly… it’s insane. I designed the whole UI in Figma, animated it with a single prompt, created the presentation, and then asked Opus to add the mockup movement together with the UI animation.
Teams are going to become faster and more productive, but I think something even more interesting is happening: our ideas can go much further now. The gap between having an idea and actually bringing it to life is getting smaller and smaller.
I think one of the most important skills for designers now is taste, knowing what looks good, what feels right, what to keep, and what to remove. And who knows… maybe next month we’ll need to develop another skill.


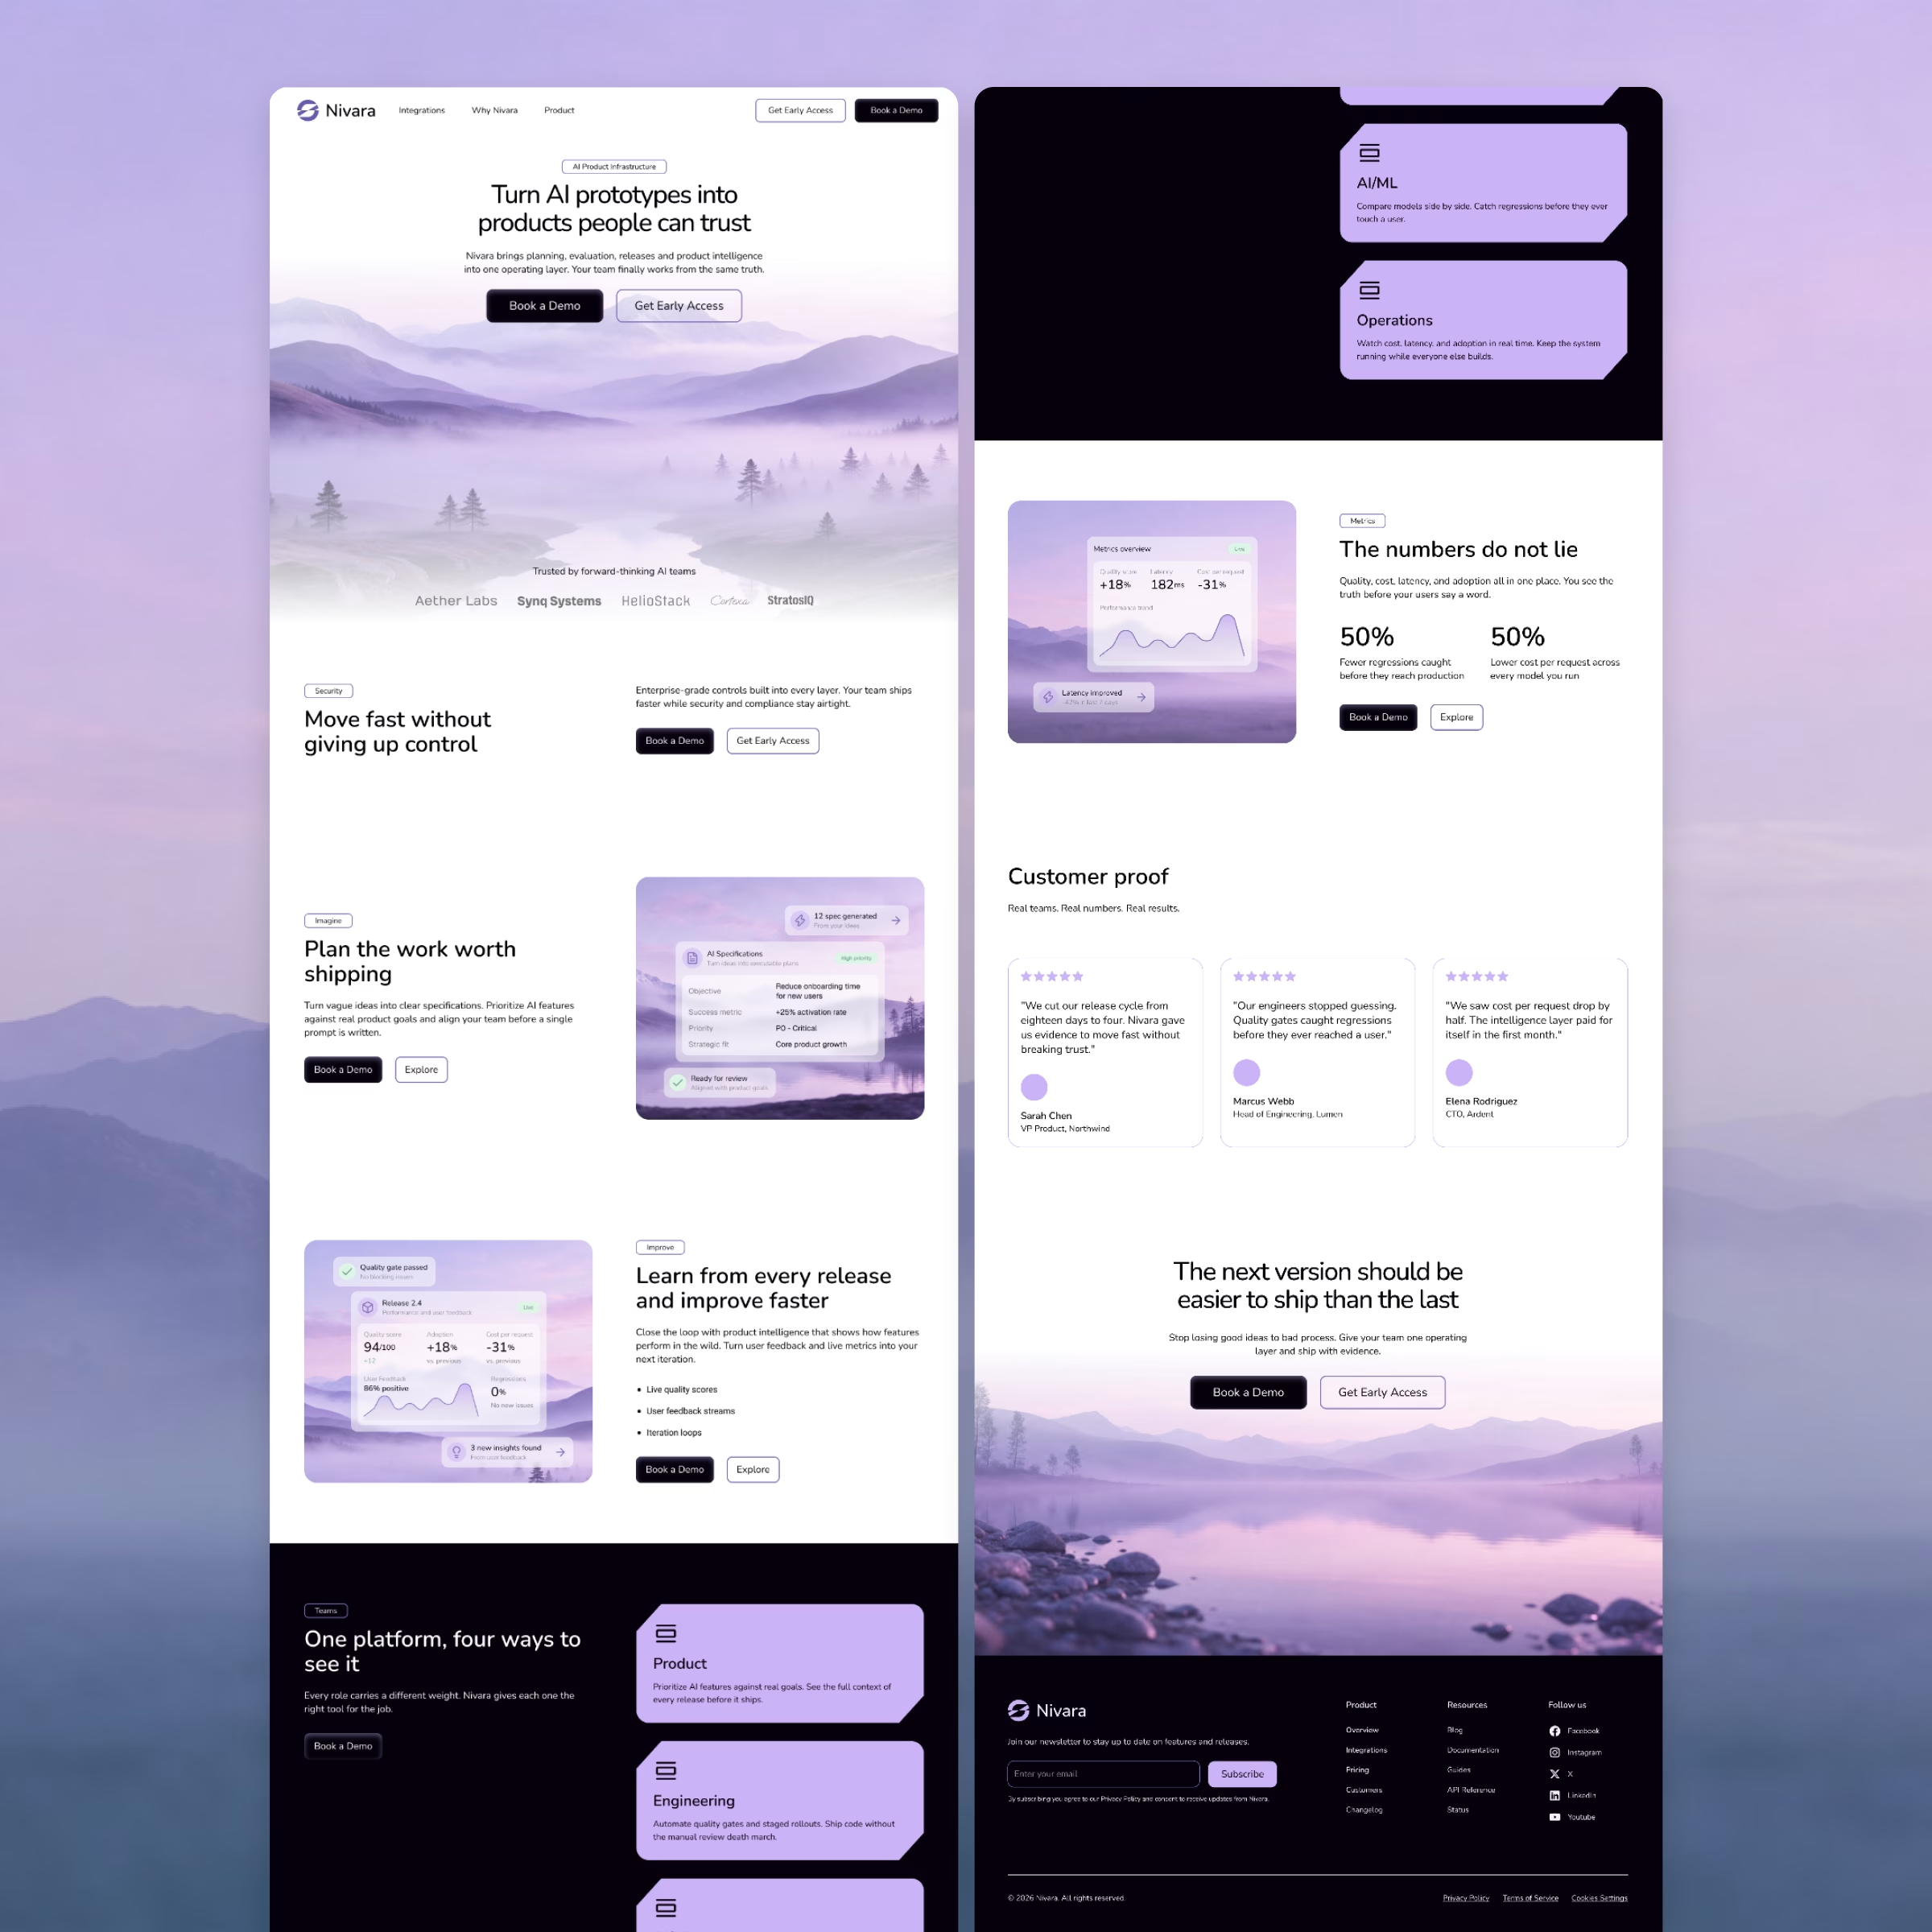

Love the soft purple palette and clean section flow!💜