The network for creativity
Join 1.25M professional creatives like you
Connect with clients, get discovered, and run your business 100% commission-free
Creatives on Contra have earned over $150M and we are just getting started
Back to feedPost

Retail Sales Performance Dashboard — Retool + PostgreSQL
A full sales analytics dashboard built in Retool, backed by a real ~10,000-row retail dataset — revenue trends, category performance, regional breakdowns, and top products, all queried live with SQL.
What's in it:
---> KPI summary cards showing total revenue and total profit across the full dataset
---> A monthly revenue trend chart showing seasonality and growth over time
---> A category breakdown showing how sales are distributed across product categories
---> A top-10 products table ranked by revenue, with units sold
---> A regional performance breakdown comparing sales and profit across regions


The network for creativity
Join 1.25M professional creatives like you
Connect with clients, get discovered, and run your business 100% commission-free
Creatives on Contra have earned over $150M and we are just getting started
Related posts


Great stuff! Would love to know what the brief looked like. You clearly took it somewhere special.

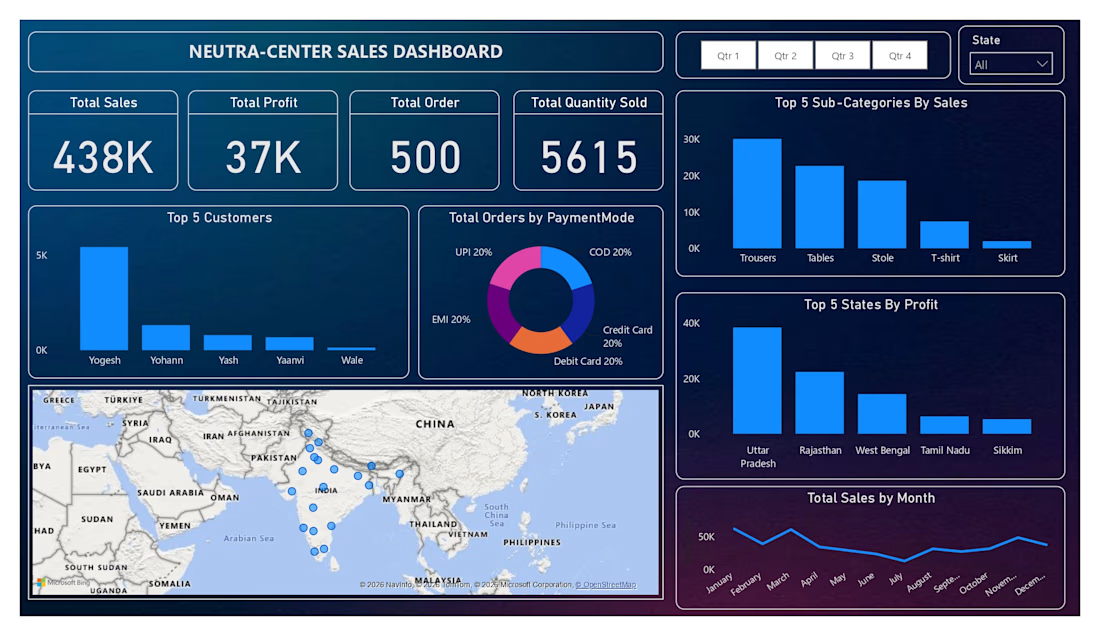
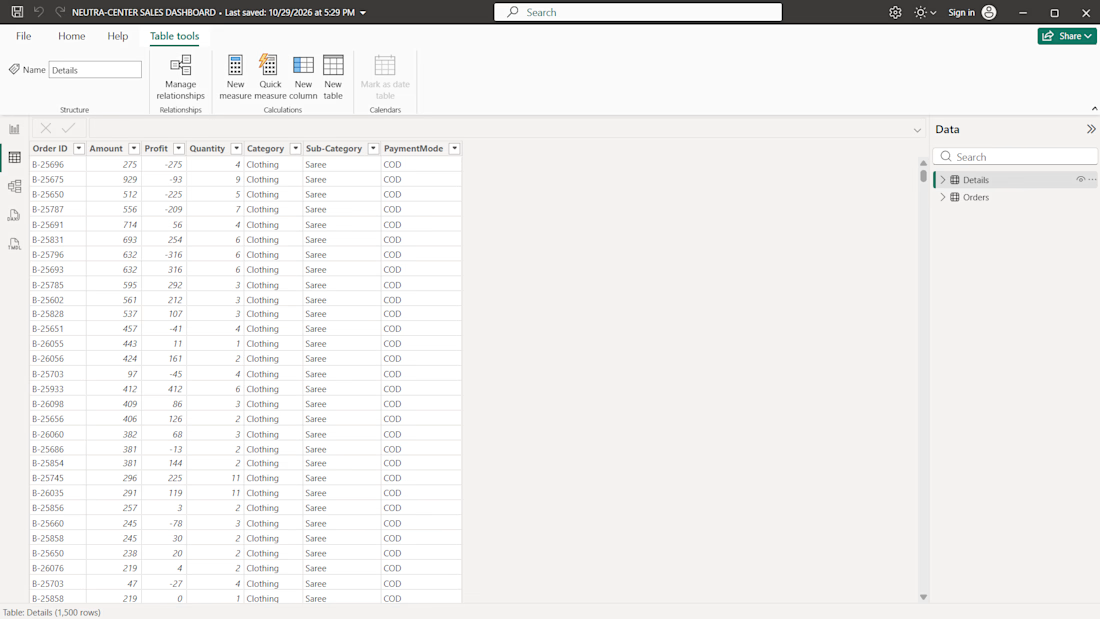
I created an interactive "Neutra-Center Sales Dashboard using Microsoft Power BI" to transform sales excel data into clear, meaningful business insights.
Key Features:
- Interactive quarterly and state filters
- Sales and profit KPI cards
- Customer and product performance analysis
- Payments method distribution
- State-wise profit coparison
- Monthly sales trend visualization
- Geographic sales distribution map
- Clean, modern dashboard design
This project demonstrates my ability to present sales data in an organized, interactive, and visually appealing format to help user understand business performance and identify important trends.




Mobile dashboard sheet interaction for sales automation platform