The network for creativity
Join 1.25M professional creatives like you
Connect with clients, get discovered, and run your business 100% commission-free
Creatives on Contra have earned over $150M and we are just getting started
Back to feedPost

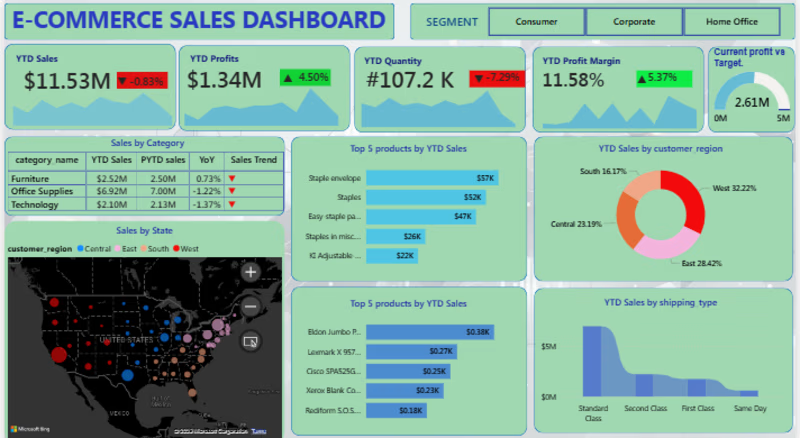
📊 Project Showcase: E-Commerce Sales Analytics Dashboard
I recently designed an interactive sales analytics dashboard using Microsoft Power BI to transform raw sales data into meaningful business insights.
Key Metrics
• Total Sales: $11.53M
• Total Profit: $1.34M
• Profit Margin: 11.58%
• Profit Target Achieved: 52%
Dashboard Capabilities
✔ Sales performance tracking (YTD)
✔ Regional and category analysis
✔ Top & bottom product insights
✔ Interactive filtering for customer segments
✔ KPI tracking using DAX measures
This dashboard helps businesses monitor performance, identify trends, and support data-driven decisions.
💼 I’m currently available for projects involving:
• Power BI dashboards
• Data visualization
• Business analytics reporting
If you need a custom dashboard for your business data, feel free to reach out.
The network for creativity
Join 1.25M professional creatives like you
Connect with clients, get discovered, and run your business 100% commission-free
Creatives on Contra have earned over $150M and we are just getting started
Related posts

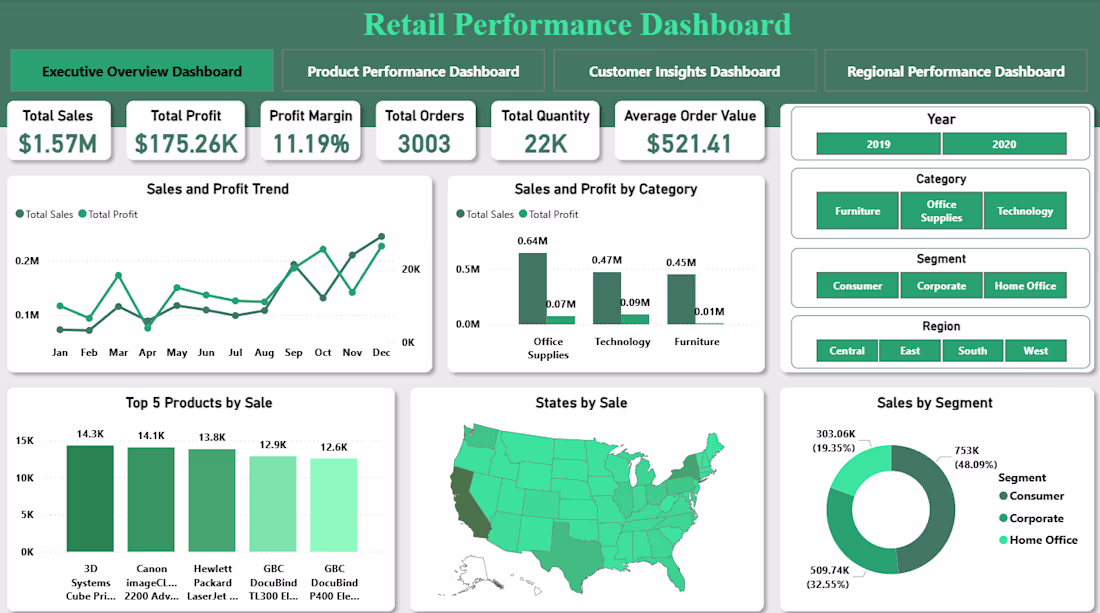
Built an interactive Retail Performance Dashboard in Power BI to analyze sales, profit, customer behavior, and regional performance. The report includes four pages: Executive Overview, Product Performance, Customer Insights, and Regional Analysis. It features KPIs, trend analysis, category comparisons, top/bottom products, customer segmentation, and geographic insights. Interactive slicers allow users to explore data by year, category, segment, and region, helping businesses make data-driven decisions and identify growth opportunities.


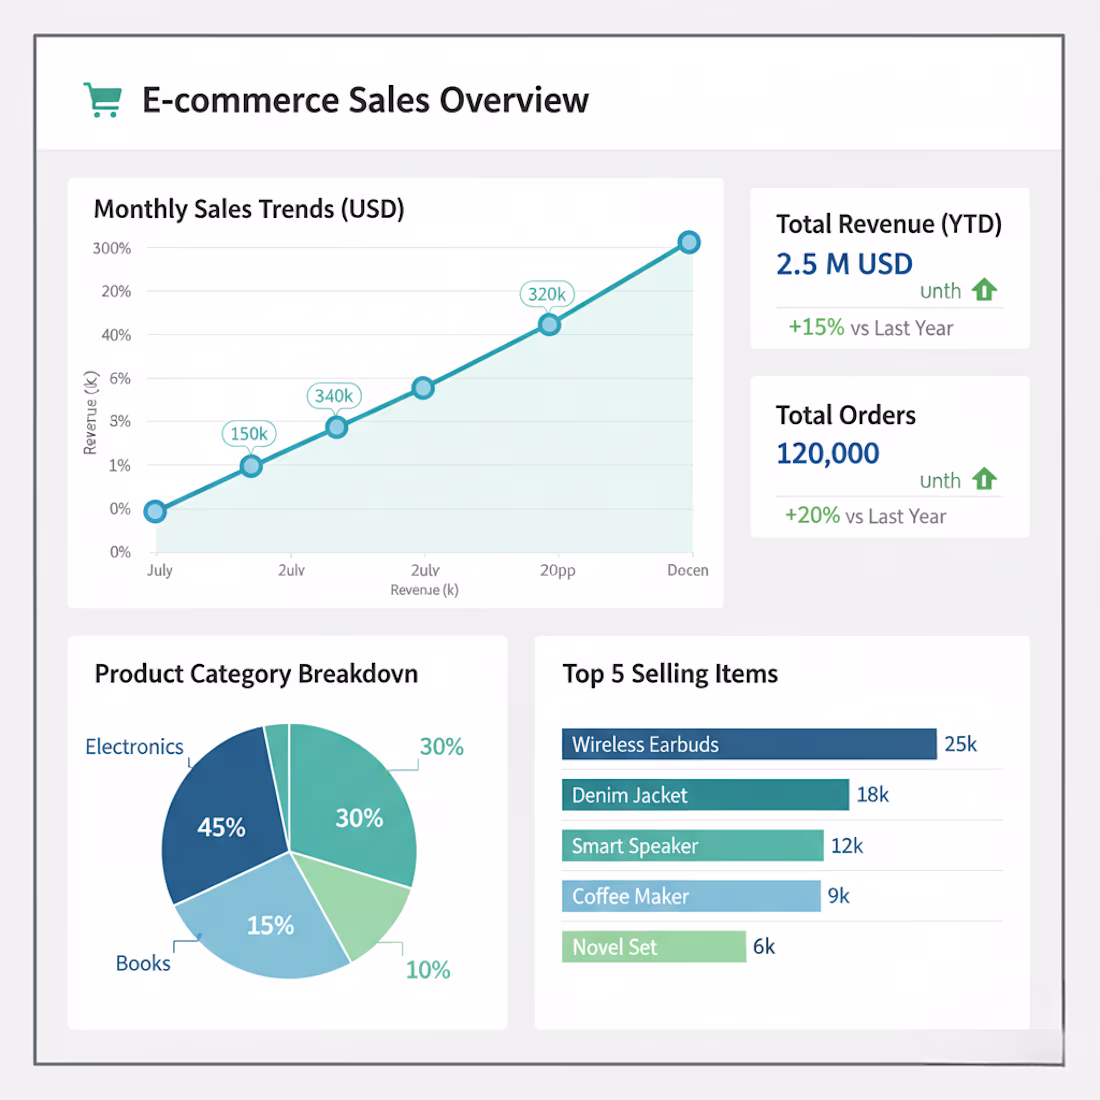
Developed an interactive sales performance dashboard for a fictional online fashion boutique experiencing fluctuating revenue. I collected and cleaned transactional data, identified key trends in customer purchasing behavior, and visualized critical metrics such as average order value, conversion rates, and popular product categories. The dashboard provides actionable insights for inventory management and targeted marketing campaigns.


Just submitted my entry for the Build with Omma by Spline challenge 🌟
A gentle, interactive space to track your time and reflect on your day.
Designed for balance, mental wellbeing, and a calmer approach to productivity.
Keeps your To Do list to 5 tasks, helping you stay focused, take small steps, and avoid overworking.🤪
Fully created with Omma AI.
https://omma.build/p/mental-health-dashboard-interface-sbqbv3


Trending


Figma Make
Go from idea to prototype in minutes. What are you designing?
brandguidelines
Brand guidelines are becoming living systems, not static documents. What are you building for your clients?
aivideo
AI video tools are moving at warp speed. Which ones are you experimenting with?
illustration
Handcrafted illustration is bubbling up across the web. What are you drawing lately?
freelancerlife
Freelancer life is wins, pivots, and everything in between. What’s yours right now?