The network for creativity
Join 1.25M professional creatives like you
Connect with clients, get discovered, and run your business 100% commission-free
Creatives on Contra have earned over $150M and we are just getting started
Back to feedPost

MACHINE LEARNING PROJECT
CUSTOMER SEGMENTATION
K-MEANS CLUSTERING
Discovering customer spending patterns through income analysis and unsupervised machine learning.
Python
K-Means
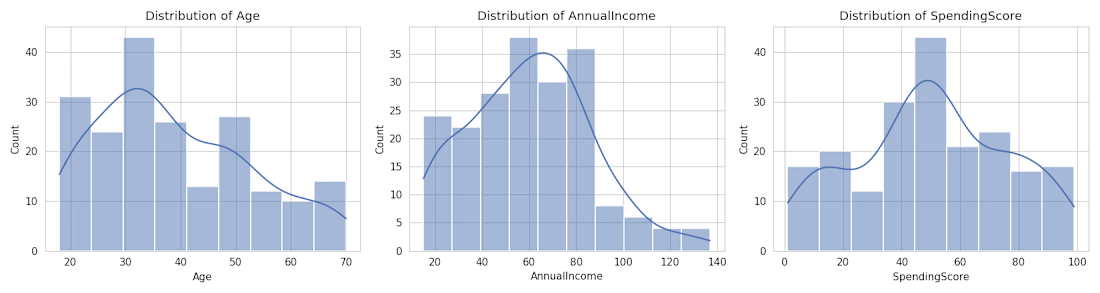
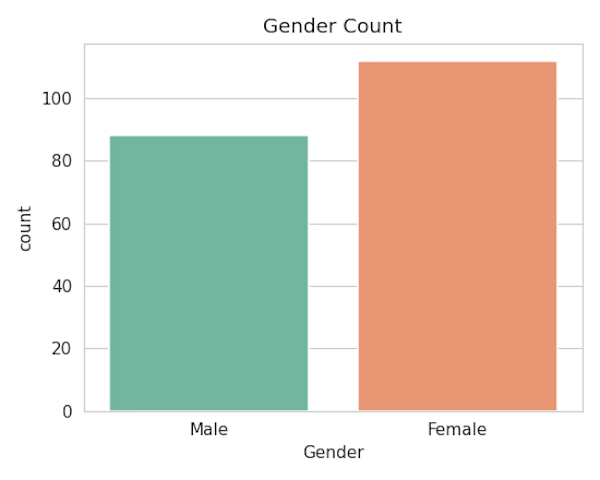
EDA
Data Visualization
Key project highlights:
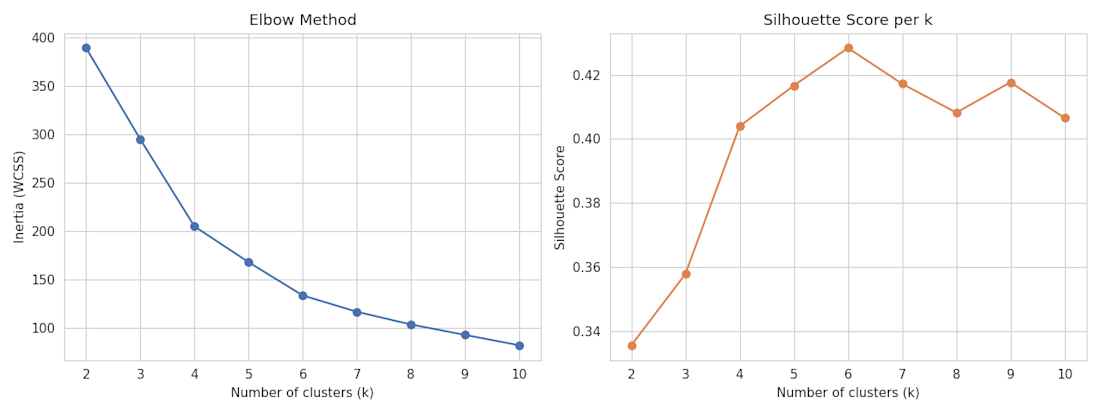
Elbow Method for cluster evaluation.
Silhouette Score for measuring cluster quality.
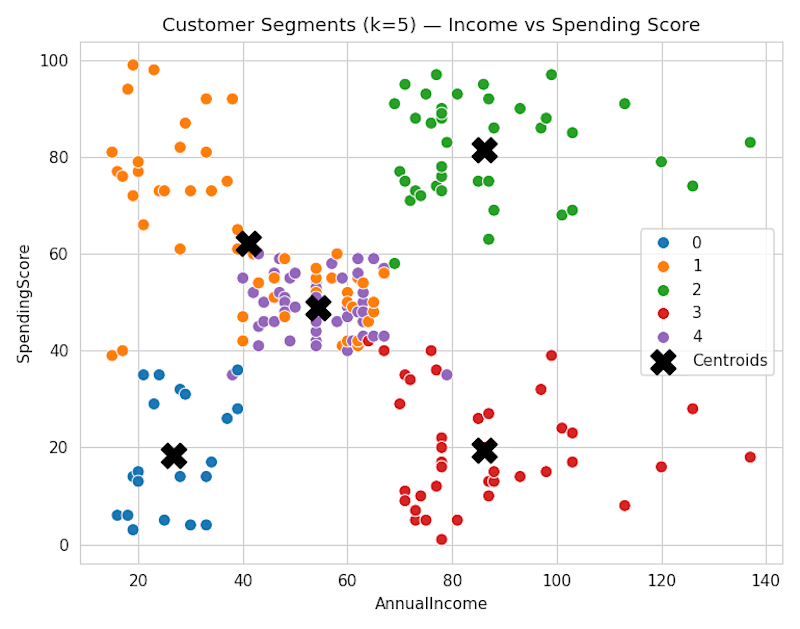
Customer segmentation using income and spending scores.
Visualization of five customer segments and their centroids.


The network for creativity
Join 1.25M professional creatives like you
Connect with clients, get discovered, and run your business 100% commission-free
Creatives on Contra have earned over $150M and we are just getting started
Related posts

Hi, I'm Manish 👋
I'm a Power BI Developer & Data Analyst from India. Over the past year at MNC, I built 30+ Power BI dashboards, including the Standard dashboard that senior leadership opens every morning to review KPIs and take decisions.
I worked on it from requirements gathering with the central team and colleagues in Germany, through UAT, to the pilot launch in India.
What I can help you with:
📊 Custom Power BI dashboards
🔧 Data cleaning & modeling (Power Query, SQL, DAX)
📥 Turning Excel reports into interactive dashboards
🔔 Automated KPI alerts with n8n
I'm now taking on freelance projects. If your team is stuck with messy spreadsheets or reports nobody reads, send me a message and let's talk.
Open to new projects. DM me!


Cargora - Cargo Fleet Management Dashboard
A maritime dashboard UI brought to life through motion.
Cargora brings vessel tracking, voyage progress, cargo manifests, fuel metrics, and port scheduling into one operational interface.
This project explores dashboard UI/UX, data visualization, and purposeful micro-interactions for complex logistics workflows.


The motion keeps dense fleet metrics operationally readable.

Can satellite machine learning tell a felled forest from a harvested field? 🛰️
At 10 metres, the answer is: only if your feature stack and your validation are built for it.
Most land-cover maps break at exactly this problem — forest loss and agricultural cycles look similar in a single image. So I built an end-to-end GeoAI system that separates them properly, from raw Sentinel-2 telemetry to an interactive cloud-native app on Google Earth Engine.
How the pipeline was engineered:
🔹 Data ingestion & atmospheric preprocessing
Harmonized Sentinel-2 Level-2A surface reflectance (10–20m) across multi-temporal epochs (2017 vs 2023), with rule-based cloud and shadow masking using the Scene Classification Layer (SCL).
🔹 Multi-spectral feature engineering
Beyond standard VNIR bands, a 10-dimensional feature stack — NDVI (canopy vigor), MNDWI (hydrological discrimination), NDMI (canopy moisture, B8 + B11), NBR (disturbance sensitivity, SWIR-2 B12).
🔹 Supervised ML & validation
100-tree Smile Random Forest with stratified random sampling referenced to ESA WorldCover v200. Performance reported through confusion matrices, Overall Accuracy, and Cohen's Kappa — not just a pretty map.
🔹 Interactive split-map deployment
A synchronized ui.SplitPanel with a docked analytics dashboard, live class legends, and non-blocking client-side statistics via evaluate() — stakeholders can explore change without touching GIS software.
Why this matters to the people who need it:
Conservation and REDD+ teams need defensible deforestation evidence. Urban planners need land-use change they can rerun. Agri-tech and environmental consultancies need a reproducible baseline fast. That's who this workflow is built for — and why every deliverable ships with a methodology report and a rerunnable script, not a dead static PDF.
Working on land-cover change, forest monitoring, or LULC classification in GEE? Send me your area of interest and time range — I'll tell you within 24 hours whether Sentinel-2 can answer your question, and what the workflow would involve.

