The network for creativity
Join 1.25M professional creatives like you
Connect with clients, get discovered, and run your business 100% commission-free
Creatives on Contra have earned over $150M and we are just getting started
Back to feedPost

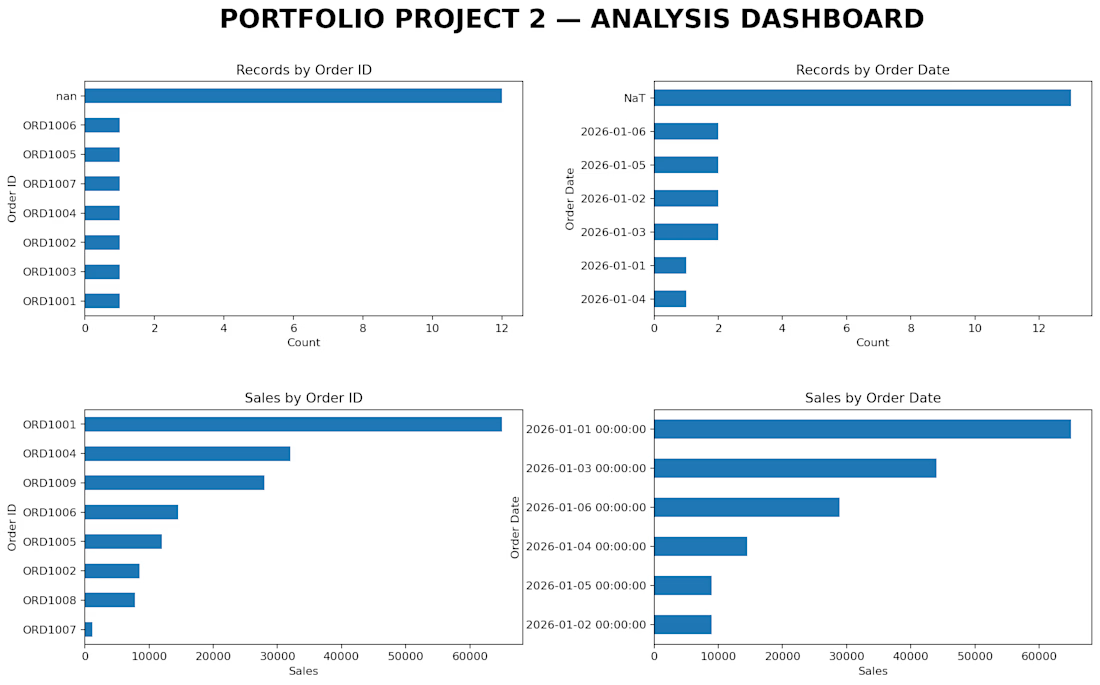
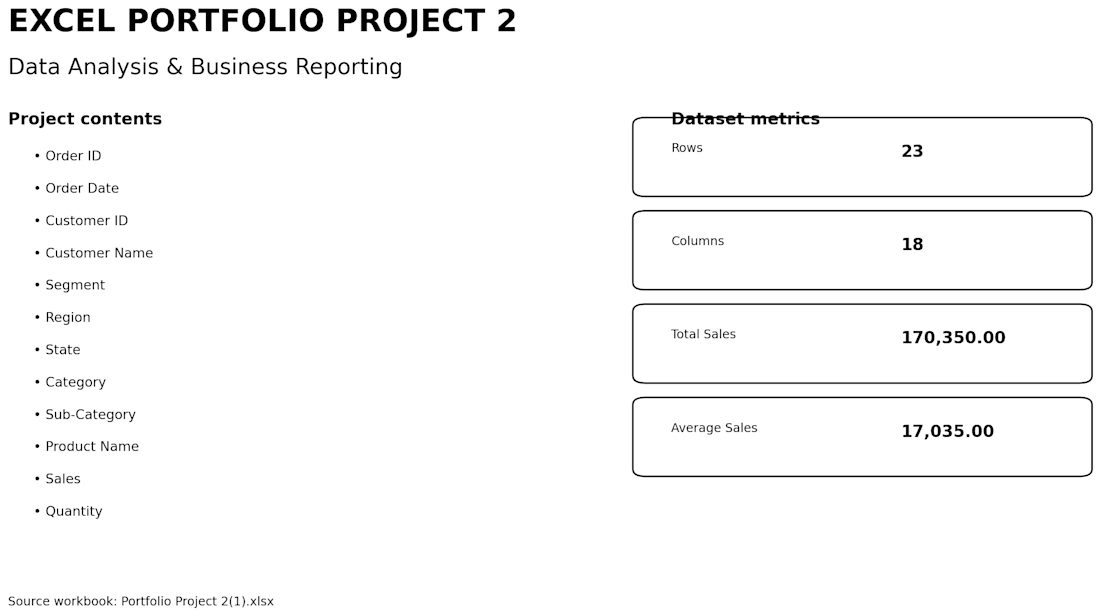
The project focuses on analyzing revenue, profitability, customers, products, regions, discounts, and order performance.
🔹 Key Analysis
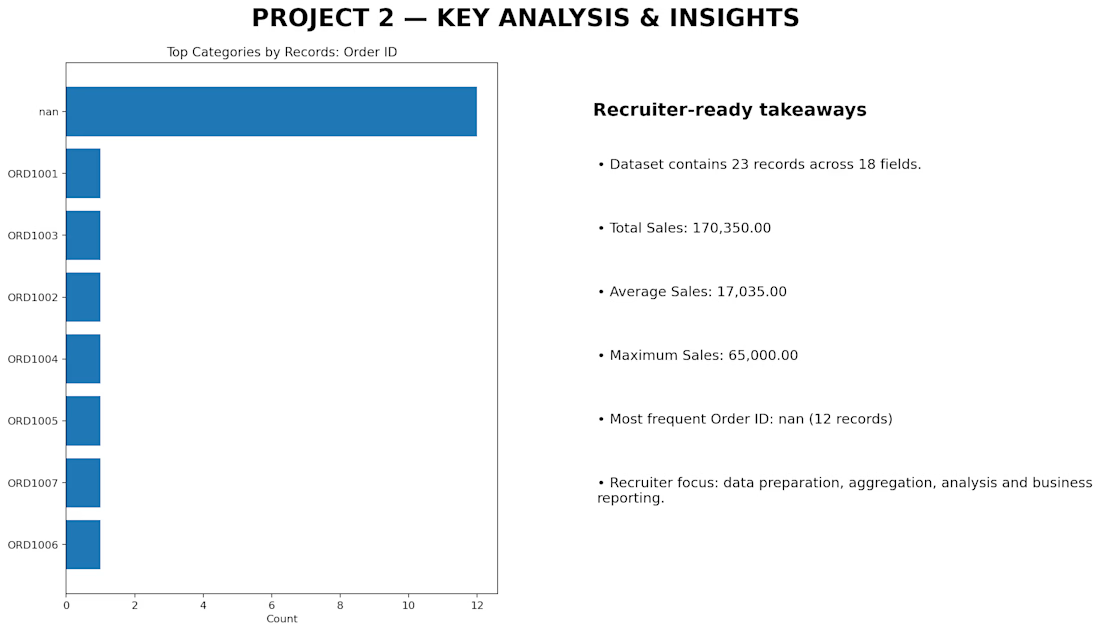
• Total Sales: ₹1,70,350
• Total Profit: ₹23,970
• Profit Margin: 13.08%
• Customer & order metrics
• Regional sales performance
• Category-wise sales analysis
• Product performance
• Profit and discount analysis
• Payment mode analysis
🛠️ Excel Skills Used
• Data Cleaning & Preparation
• Excel Formulas & Calculations
• KPI Cards
• Pivot Tables
• Sales & Profit Analysis
• Dashboard Design
• Business Insights & Reporting
🎯 Project Goal:
To transform raw sales data into meaningful KPIs, visual analysis, and business insights that can support better sales and profitability decisions.
This project helped me strengthen my practical Excel and business analytics skills.
Project Link : https://github.com/rajveer7489/sales-financial-kpi-dashboard

The network for creativity
Join 1.25M professional creatives like you
Connect with clients, get discovered, and run your business 100% commission-free
Creatives on Contra have earned over $150M and we are just getting started

Challenges
View all


Related posts

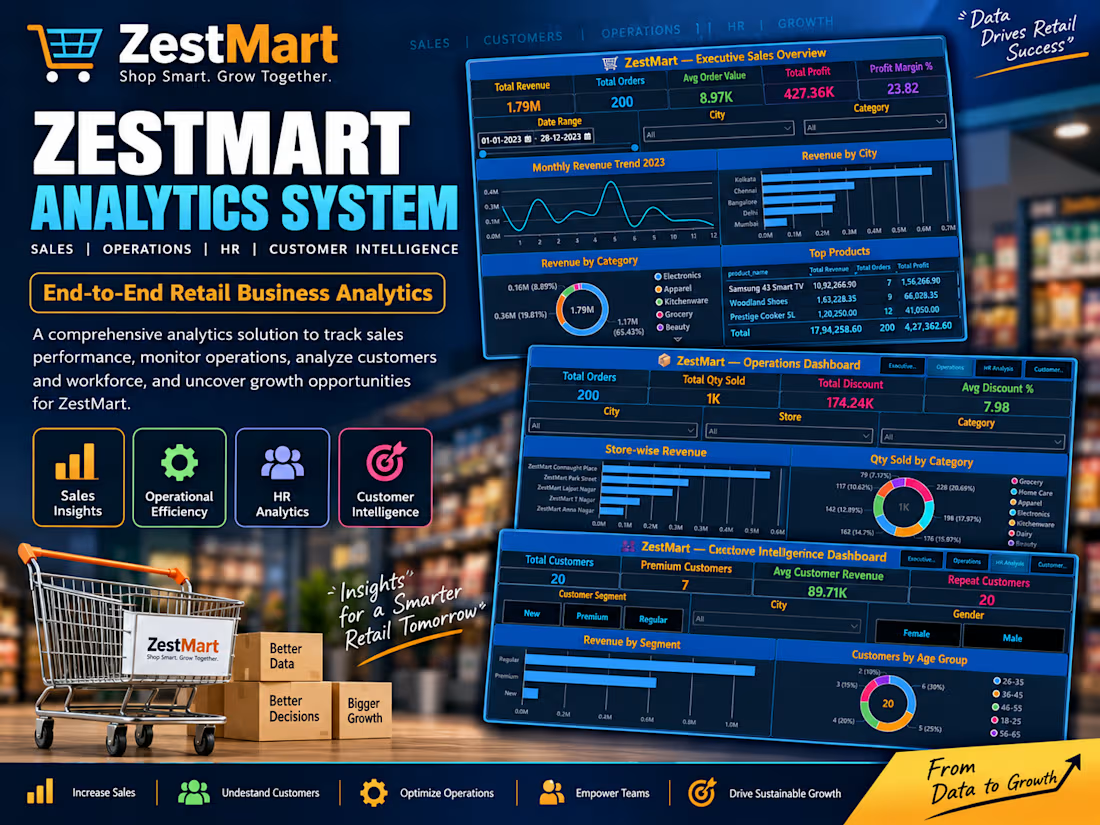
Hi, I'm Rohan — a data analyst who turns messy data into clean dashboards and clear business insights 📊
Recently completed a 20-day end-to-end analytics pipeline (Excel → SQL → Python → Power BI) for a fictional retail chain — 4 interactive dashboards tracking sales, operations, HR & customer intelligence, with ₹1.79M in revenue analyzed across 200 orders.
I also work on HR analytics, real estate dashboards, and retail sales analysis — check out my full portfolio below 👇
Open to data cleaning, dashboard building, and SQL/analytics projects of any size. Let's turn your data into decisions!
#DataAnalytics #PowerBI #SQL #Excel #Python

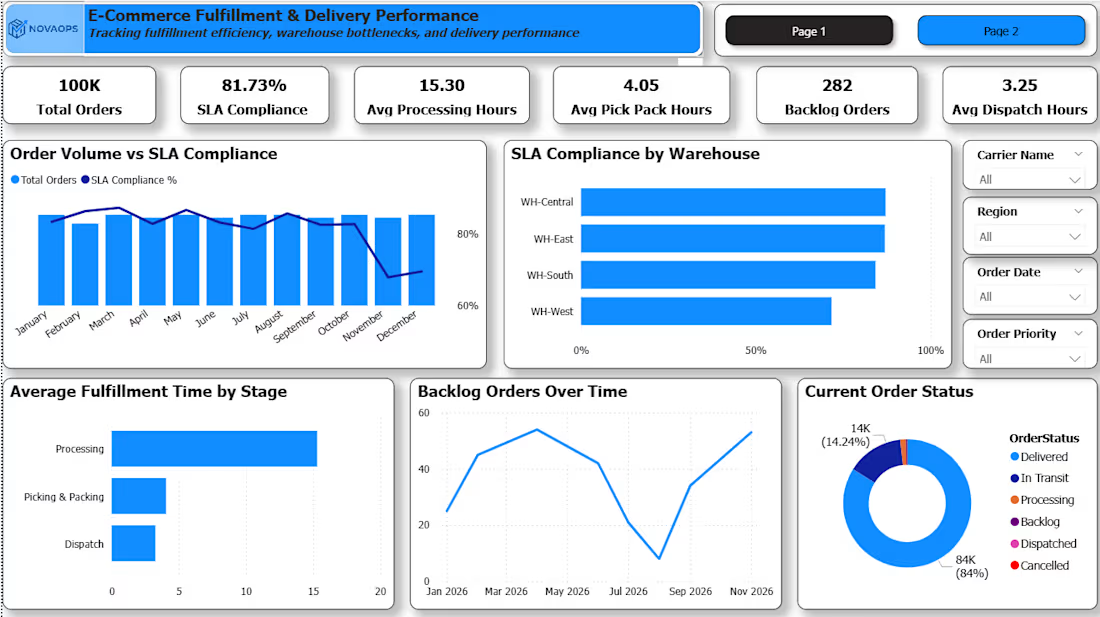
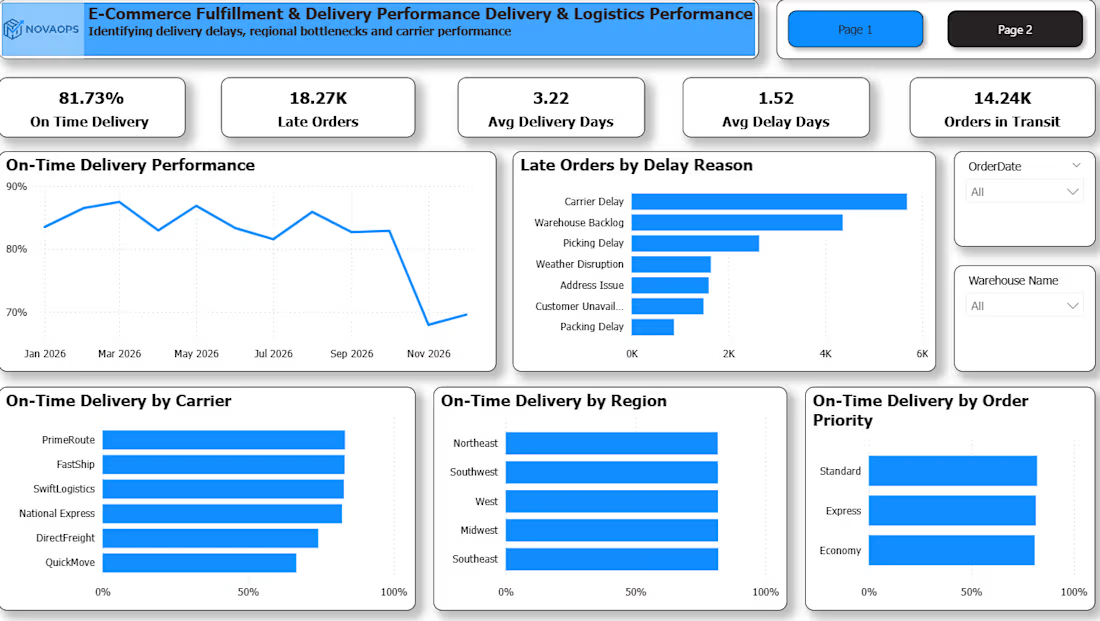
NovaOps — E-commerce & Operations Analytics
The problem:
Many businesses have plenty of sales and operational data, but still struggle to answer the questions that affect revenue, inventory, fulfillment, and day-to-day decisions.
Important problems can stay hidden:
Revenue or sales performance starts declining without a clear reason.
Poor-performing products are difficult to identify.
Inventory issues can lead to stockouts, excess stock, or missed sales.
Delivery and fulfillment delays affect customer experience.
Operational inefficiencies remain buried inside spreadsheets and raw data.
Management spends too much time compiling reports instead of acting on them.
NovaOps turns that data into something management can actually use.
It is an E-commerce & Operations Analytics solution designed to help businesses monitor performance, identify problems, uncover opportunities, and make faster, data-driven decisions.
What NovaOps helps solve
📊 Sales Performance — Understand revenue, orders, products, and trends.
📦 Inventory & Stock Risk — Identify products that need attention before inventory problems become costly.
🚚 Fulfillment & Delivery — Monitor operational performance and uncover delays and bottlenecks.
🔎 Performance Gaps — Quickly see where the business is underperforming and what deserves attention.
💡 Decision Support — Transform raw business data into clear insights and actionable recommendations.
The business value
Instead of spending hours going through spreadsheets and disconnected reports, decision-makers get a clearer view of what is happening, why it matters, and where to act.
NovaOps can help businesses reduce avoidable losses, improve operational visibility, identify revenue opportunities, and make better decisions faster.
Built with SQL, Excel, and Power BI, with the focus always on the business problem not just the charts.
If your business has data but you're not getting enough value from it, NovaOps is built to close that gap.



Hi Mamman,
i am freelancer data analyst too. that's good to hear about that program, that can help me more to start with a better project.
Therefore i'd like to give it a try to start project with you anytime

Interactive 3D Product Visualization Gallery -
It shows 360° spaces, 3D product visualization, sustainability concepts, and product storytelling.


This is a great example of letting the environment carry the product story—the 360° spaces, gallery framing, and sustainability cues feel much more immersive than a standard catalog grid. The AptiCraft presentation also makes the transition from exploration to product detail feel especially natural.