The network for creativity
Join 1.25M professional creatives like you
Connect with clients, get discovered, and run your business 100% commission-free
Creatives on Contra have earned over $150M and we are just getting started
Back to feedPost

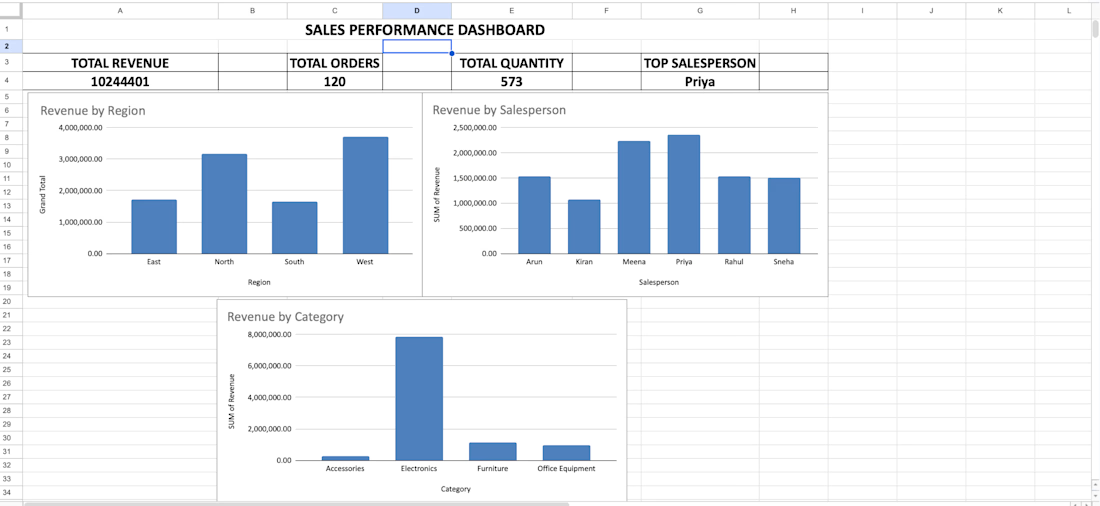
Created a Sales Performance Dashboard using Microsoft Excel to analyze sales data and present key business insights in a clear and professional format.
The project includes data cleaning, Pivot Tables, Pivot Charts, KPI calculations, and dashboard design. The dashboard presents Total Revenue, Total Orders, Total Quantity, Top Salesperson, Revenue by Region, Revenue by Salesperson, and Revenue by Product Category.
The dashboard helps users quickly understand sales performance, compare regions and salespeople, identify top performers, and analyze product category revenue. This project demonstrates practical skills in Excel data analysis, reporting, visualization, and dashboard creation.


The network for creativity
Join 1.25M professional creatives like you
Connect with clients, get discovered, and run your business 100% commission-free
Creatives on Contra have earned over $150M and we are just getting started

Challenges
View all


Related posts

Animated Fintech UI for pie showing portfolio performance, Investment income, Investment advisory, and smart advisory features through interactive financial visualization
A motion exploration for Pie, bringing key wealth-management features to life through animated UI components.
The concept explores how portfolio performance, investment income, investment advisory, and smart advisory can be presented in a clear and engaging way while keeping the overall experience simple and premium.
A look at how motion can make financial products feel more intuitive, modern, and easier to understand.


The motion-led charts make a dense wealth-management story feel approachable; the distinct panels give each metric room to breathe while still reading as one system.

Does someone on your team lose a day or two building the sales report every week or month?
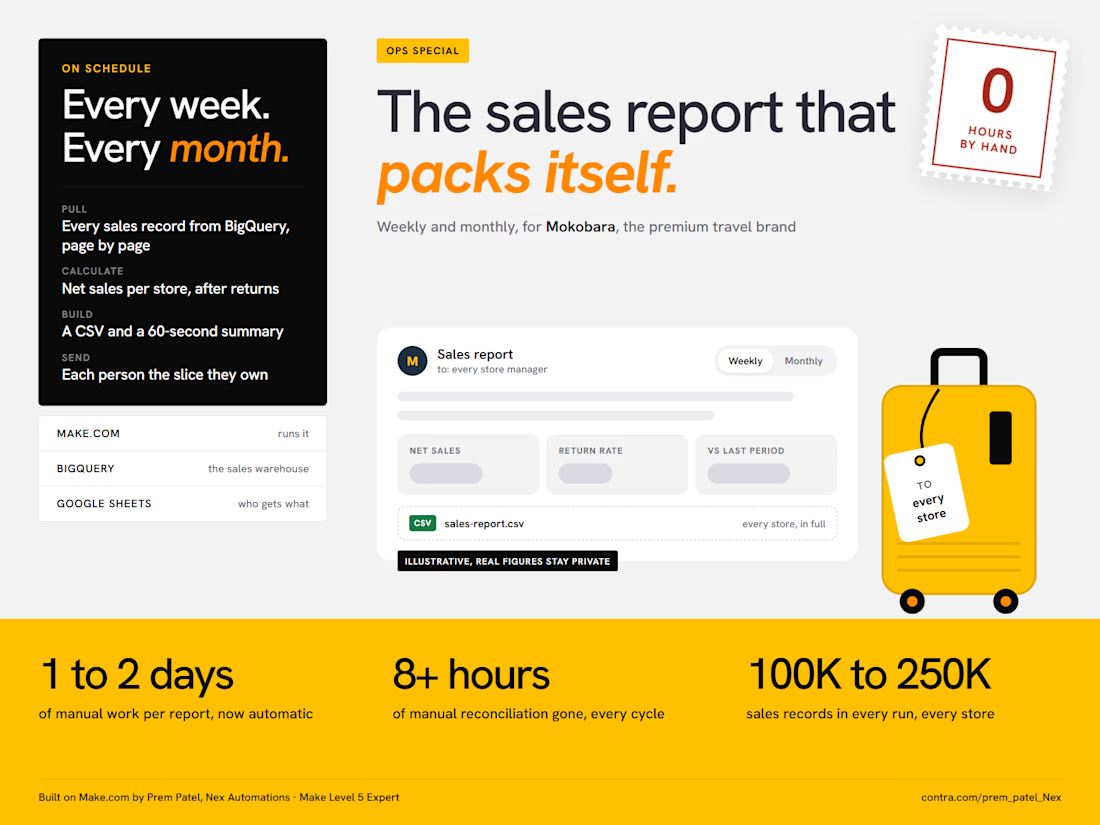
That was the starting point at Mokobara, the premium travel brand. Pulling sales across all their stores, checking returns, reconciling the numbers and emailing each manager took 1 to 2 days every cycle, with 8+ hours of that spent just reconciling.
I built them an automation on Make.com a few months ago. It has run on its own ever since, weekly and monthly:
Make pulls every sales record from BigQuery, 100K to 250K per cycle. That is too many for one request, so it reads them page by page and stitches them back together.
It calculates the numbers the team actually uses: net sales per store after returns and discounts, return rates and the change against the last period.
It builds a CSV with the full breakdown and a short email summary you can read in 60 seconds.
It reads a Google Sheet of store representatives and emails every one of them the report for their own store.
The result: the reporting problem is gone. The report went from 1 to 2 days of manual work to fully automatic, and the 8+ hours of reconciliation dropped to zero.
Two things I would do the same way again:
Calculate "net sales" in the automation, not in the warehouse. The business rule for what counts as a net sale is not what the raw data stores.
Send people their slice, not the whole report. One report for everyone gets skimmed by everyone.
The figures in the image are placeholders, the real ones stay with the client.
What report is your team still building by hand? Tell me where the data lives and I will tell you how I would automate it.



Hi, I'm Rohan — a data analyst who turns messy data into clean dashboards and clear business insights 📊
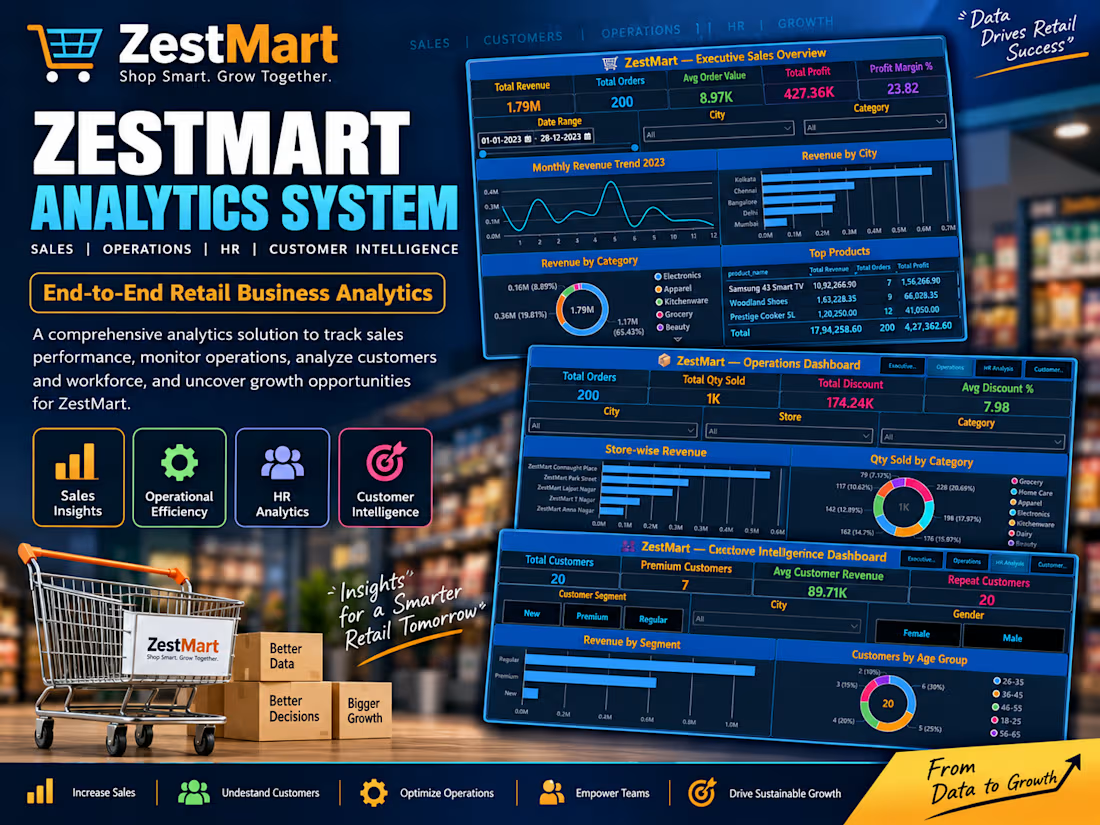
Recently completed a 20-day end-to-end analytics pipeline (Excel → SQL → Python → Power BI) for a fictional retail chain — 4 interactive dashboards tracking sales, operations, HR & customer intelligence, with ₹1.79M in revenue analyzed across 200 orders.
I also work on HR analytics, real estate dashboards, and retail sales analysis — check out my full portfolio below 👇
Open to data cleaning, dashboard building, and SQL/analytics projects of any size. Let's turn your data into decisions!
#DataAnalytics #PowerBI #SQL #Excel #Python