The network for creativity
Join 1.25M professional creatives like you
Connect with clients, get discovered, and run your business 100% commission-free
Creatives on Contra have earned over $150M and we are just getting started
Back to feedPost

A platform built with React.js, Node.js, and MongoDB for aggregating Google Ads and Facebook Ads metrics, providing all ad analytics in one dashboard.


The network for creativity
Join 1.25M professional creatives like you
Connect with clients, get discovered, and run your business 100% commission-free
Creatives on Contra have earned over $150M and we are just getting started
Related posts

Business data often lives across payment, analytics, CRM, advertising, and inventory platforms. Metrik brings those signals together in one dashboard built for startups and small businesses.
See revenue, orders, customers, and business health at a glance. Compare advertising spend and ROAS across channels, explore visual KPI cards, and use smart alerts to spot unusual changes and potential risks.
The interface pairs a clean layout and rounded components with soft gradients, colorful analytics, and clear visual hierarchy, helping make business performance easier to follow.


Blog Listening Web Application With Admin Dashboard.
webdesignappdesignadmindesignBackend DevelopmentFrontend DevelopmentFull Stack DevelopmentExpressJSNext.jsTailwind CSS


This interactive dashboard provides a comprehensive view of profit performance across multiple dimensions—time, segments, regions, categories, and sub‑categories.
This dashboard transforms raw business data into actionable insights by allowing stakeholders to quickly identify profitable areas, spot regional trends, and evaluate category performance. It’s designed for clarity, interactivity, and decision‑making support.


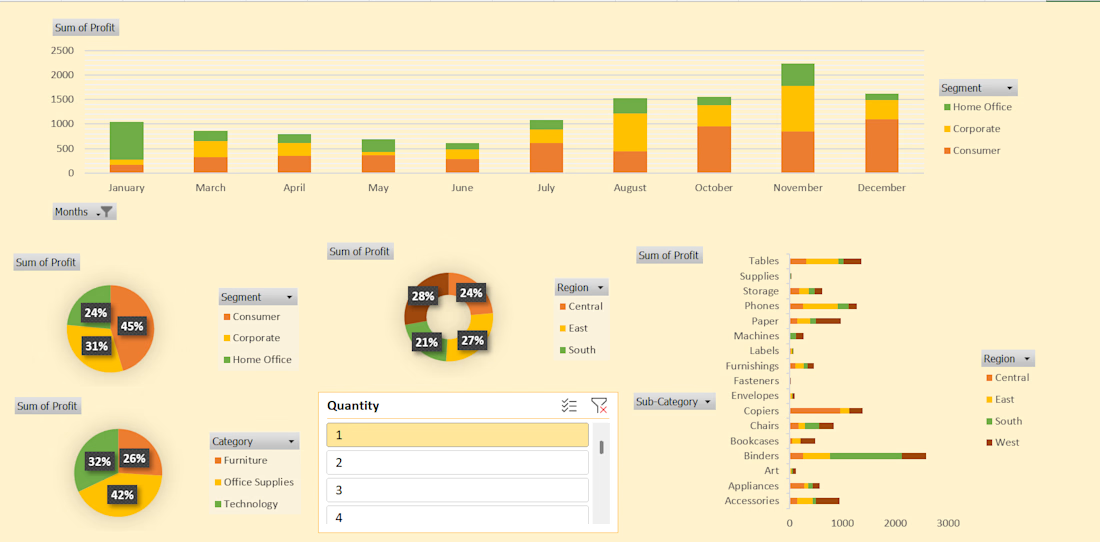
#This is an excellent Profit Dashboard which is made in MS Excel with multiple creative functions help in understanding Monthly , Yearly , Area wise Profits.