The network for creativity
Join 1.25M professional creatives like you
Connect with clients, get discovered, and run your business 100% commission-free
Creatives on Contra have earned over $150M and we are just getting started
Back to feedPost
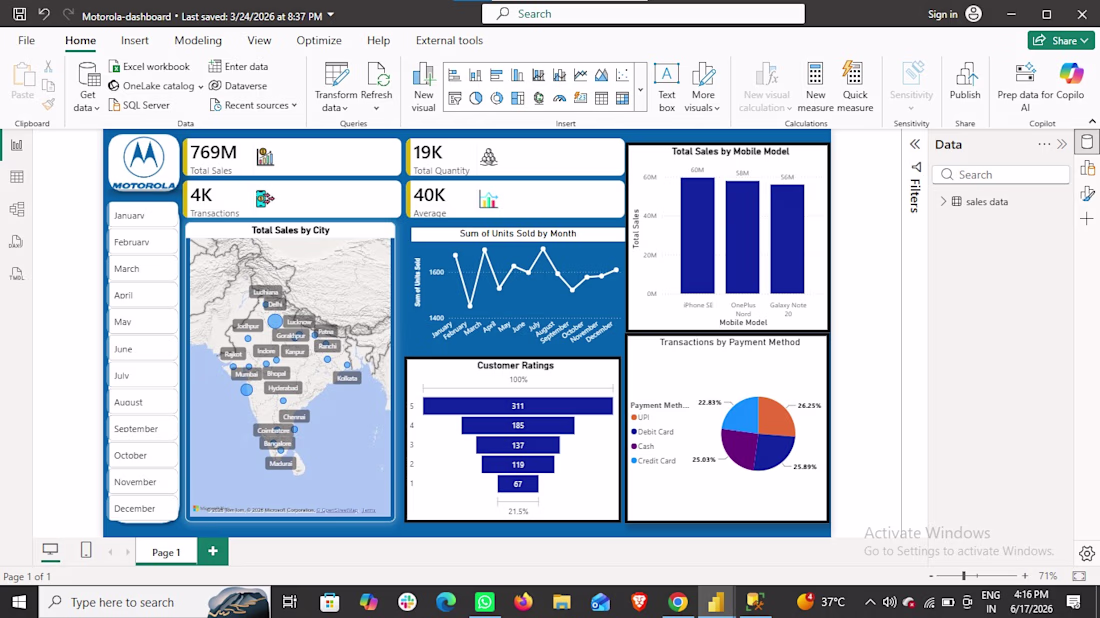
Telecom Sales & Operations Performance Dashboard (Motorola)
Business Problem: Leadership required an interactive view into device sales, transaction volumes, geographic distribution, and payment metrics to optimize local market inventory.
Tools Used: Power BI, Power Query, DAX, Geographic Mapping
KPIs Tracked: Total Sales ($769M), Total Quantity (19K), Total Transactions (4K), Average Sales Value (40K).
Insights Discovered:
Geographic Concentrators: North and Central India (hubs like Delhi and Lucknow) represent the highest density of retail transaction volume.
Product Drivers: The iPhone SE, OnePlus Nord, and Galaxy Note 30 drive the bulk of high-value mobile revenue.
Financial Channels: Payment ecosystems are highly diversified, with Credit Cards (26.25%) and Debit Cards (25.03%) dominating customer checkouts over cash.
The network for creativity
Join 1.25M professional creatives like you
Connect with clients, get discovered, and run your business 100% commission-free
Creatives on Contra have earned over $150M and we are just getting started
Related posts
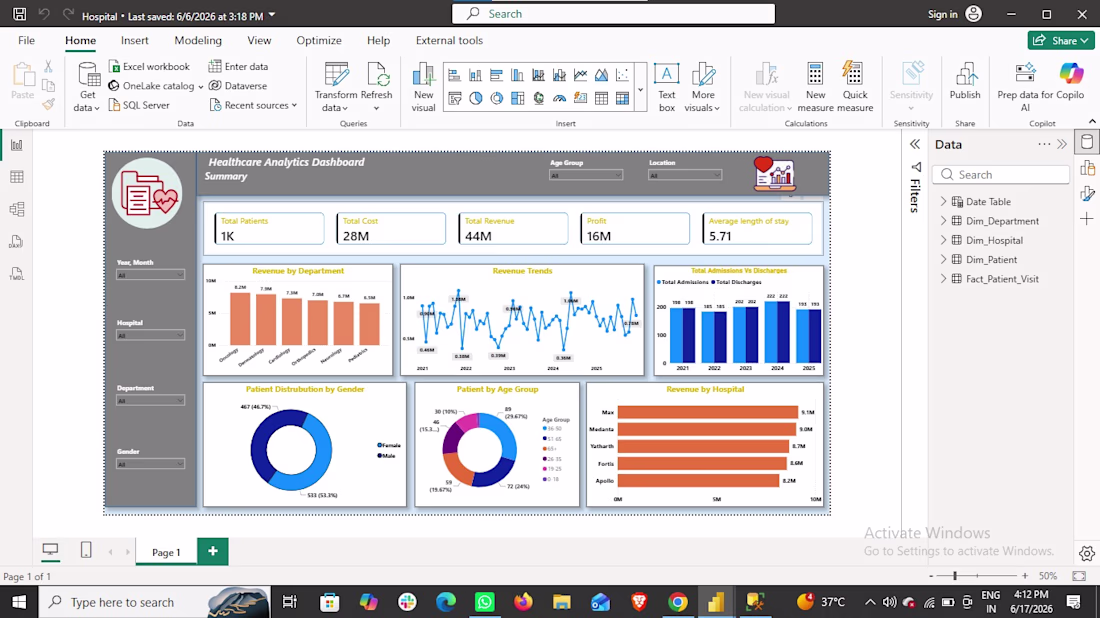
Healthcare & Clinical Operations Analytics Dashboard
Business Problem: Hospital executives needed to monitor financial health (revenue vs. margins), admission velocities, and demographic distributions to manage clinical capacity.
Tools Used: Power BI, Data Modeling, Relational Star Schema (Fact_Patient_Visit, Dim_Patient, Dim_Hospital)
KPIs Tracked: Total Patients (1K), Total Cost ($28M), Total Revenue ($44M), Net Profit ($16M), Average Length of Stay (5.71 days).
Insights Discovered:
Department Profitability: The Diagnostics and Cardiology departments function as the primary revenue engines for the medical system.
Age & Gender Dynamics: Female patients account for the majority slice of admissions (53.3%), with the 18–30 age bracket representing the highest volume segment (29.67%).
Facility Ranking: Max Hospital leads the healthcare network's financial footprint, generating $9.1M in revenue.
Awesome work! Highly functional, intuitive, and every pixel is exactly where it needs to be. Looking forward to seeing more projects! ✨🙌
Power BI Sales Analytics Dashboard (4 pages)
🔗 Live Preview: View the interactive dashboard before purchase https://app.powerbi.com/view?r=eyJrIjoiYjcwNWE2OWYtM2ViZi00NDc5LTlmMTgtZWMzN2IxN2JkYTY1IiwidCI6IjYyZTI4NmIzLWE4ZDMtNDFkYS04Y2E4LWUwNzFhZTMxZGUwMiIsImMiOjl9&pageName=cd07523f864688ce9c1b
Designed to help you analyze revenue, sales performance, customer behavior, and product insights in one professional report. This editable template includes 4 interactive pages with modern visuals, KPI tracking, and dynamic filtering.
✨ What makes this dashboard special? • Clean and professional design suitable for any business • Fully editable Power BI (.pbix) file included • 4 ready-to-use pages: Business Overview, Sales Performance, Customer Analytics, Product Performance • Interactive filters and drill-down capabilities • Sample dataset included for easy customization • Perfect for portfolio, business analysis, or client reporting
Trending
Claude
Claude has entered the design space. How are you using Claude Design?
Contra University
Learn from expert creatives how to earn more using next-gen AI tools.
MagicPath
The canvas is infinite, and exploration is becoming the workflow. How are you using MagicPath?
creativeaiflow
Creative AI workflows are evolving. What tools do you use, and what are their strengths and weaknesses?
freelancerlife
Freelancer life is wins, pivots, and everything in between. What’s yours right now?