The network for creativity
Join 1.25M professional creatives like you
Connect with clients, get discovered, and run your business 100% commission-free
Creatives on Contra have earned over $150M and we are just getting started
Back to feedPost

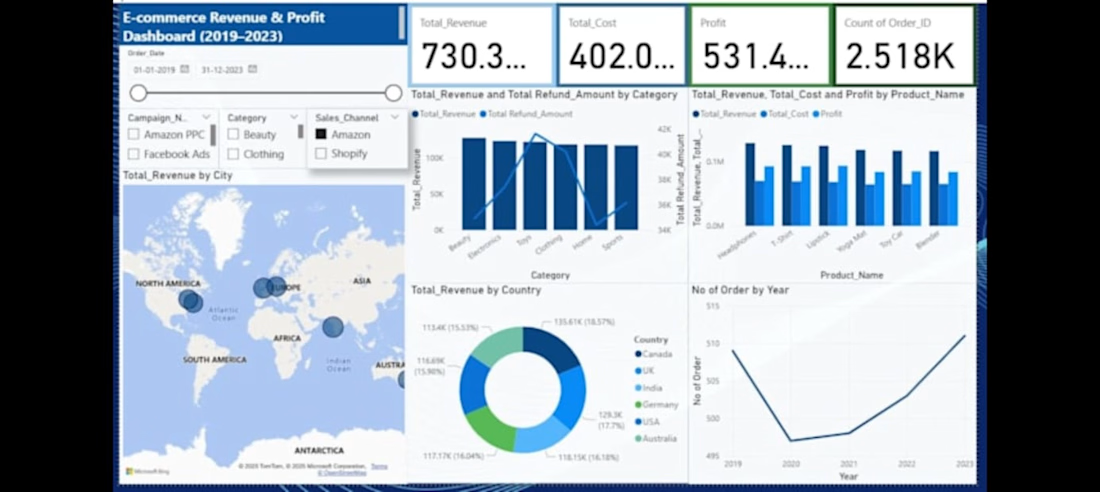
E-commerce Revenue & Profit Dashboard | Power BI
Built an interactive Power BI dashboard using sample e-commerce data to analyze revenue, costs, profit, orders, products, categories, and geographic performance.
The dashboard includes KPI cards, revenue and profit trends, category analysis, country-level performance, product comparisons, and order-volume trends. Interactive filters allow users to explore the data by date, campaign, category, sales channel, and other dimensions.


The network for creativity
Join 1.25M professional creatives like you
Connect with clients, get discovered, and run your business 100% commission-free
Creatives on Contra have earned over $150M and we are just getting started





Related posts

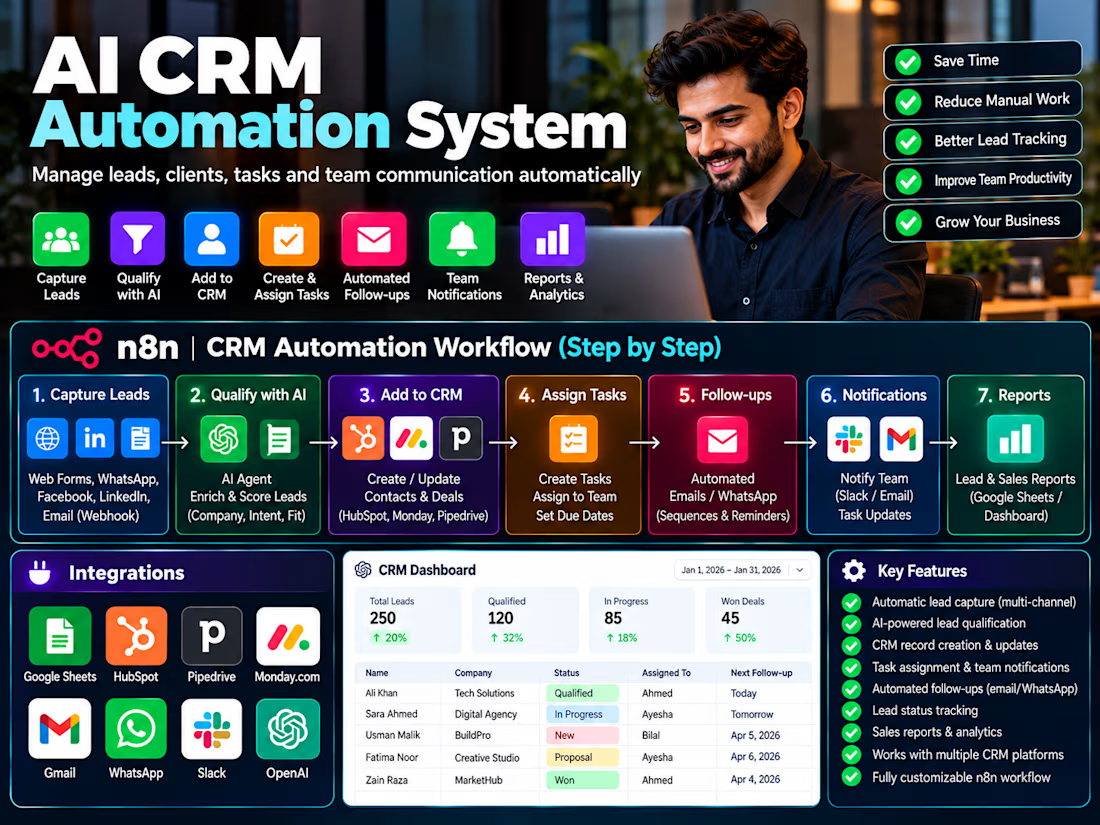
Built an n8n CRM automation system that captures leads, creates and updates CRM records, assigns tasks, sends team notifications, automates follow-ups and generates reports.


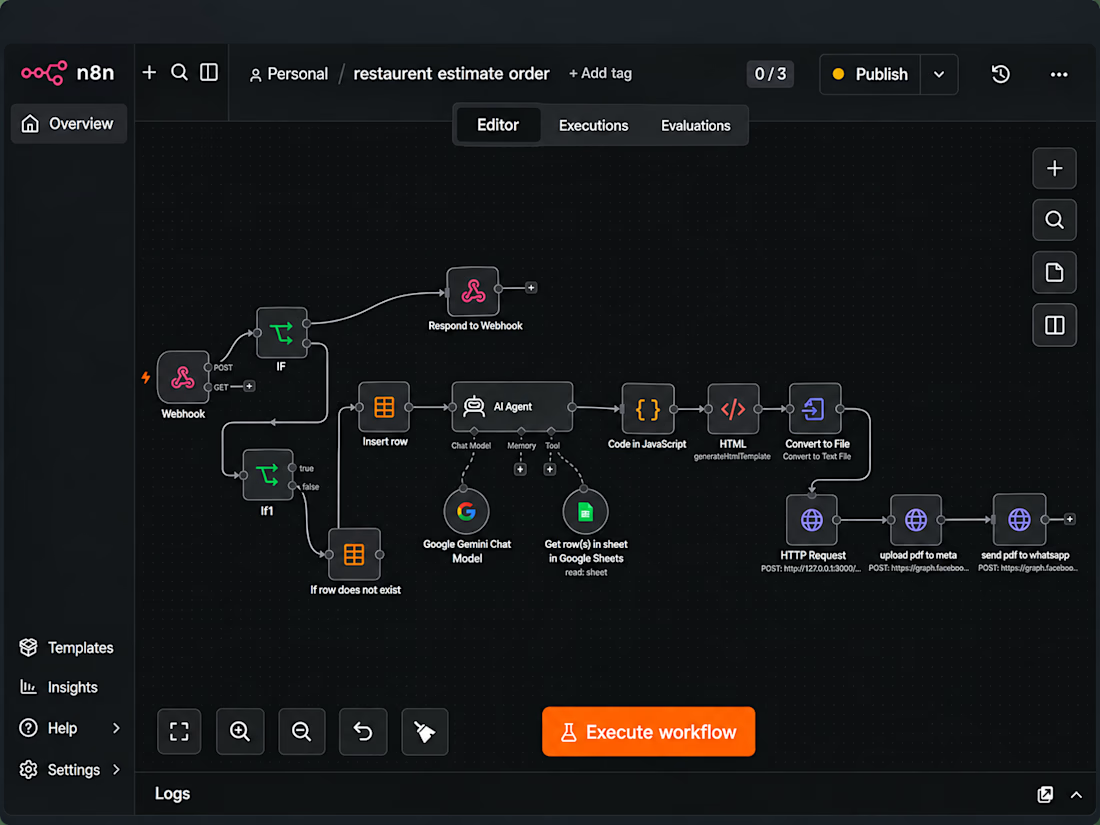
Restaurant Automation System. Automates WhatsApp orders, menu & pricing lookup, estimate generation, PDF invoices, and order processing using n8n, Google Sheets, Gemini AI and WhatsApp Cloud API.



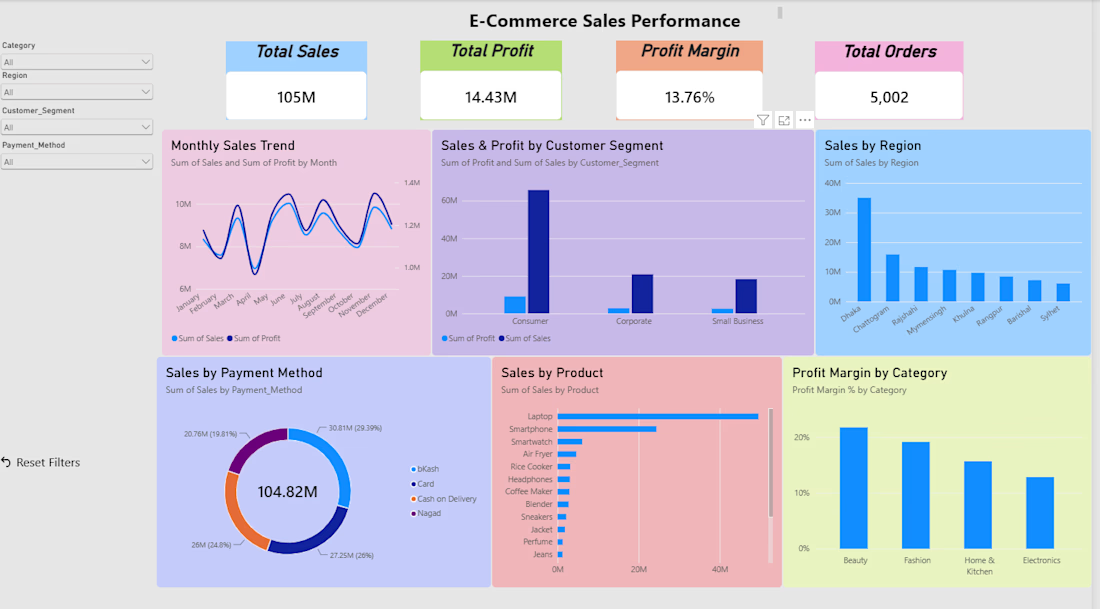
E-Commerce Sales & Profit Analysis | Power BI Dashboard
Project Description
An end-to-end e-commerce analytics project focused on understanding sales performance, profitability, customer behavior, and regional trends.
I analyzed 5,000+ orders to identify key business trends and performance drivers.
Key Areas Analyzed:
📈 Total Sales & Profit
📅 Monthly Sales Trends
👥 Customer Segment Performance
🌍 Regional Sales Analysis
📦 Product Performance
💰 Profit Margin by Category
💳 Payment Method Analysis
What I did:
• Cleaned and prepared the dataset using Excel
• Performed SQL-based analysis using PostgreSQL
• Built an interactive Power BI dashboard
• Created KPIs and visualizations to track business performance
• Analyzed sales, profit, customers, products, and regional performance
• Generated business insights from the analyzed data
Tools:
Excel • PostgreSQL • SQL • Power BI
Workflow:
Raw Data → Excel → PostgreSQL → SQL Analysis → Power BI → Business Insights
Outcome:
The dashboard provides a clear view of e-commerce performance and helps identify sales trends, profitable categories, customer segments, and areas for business improvement.