The network for creativity
Join 1.25M professional creatives like you
Connect with clients, get discovered, and run your business 100% commission-free
Creatives on Contra have earned over $150M and we are just getting started
Back to feedPost

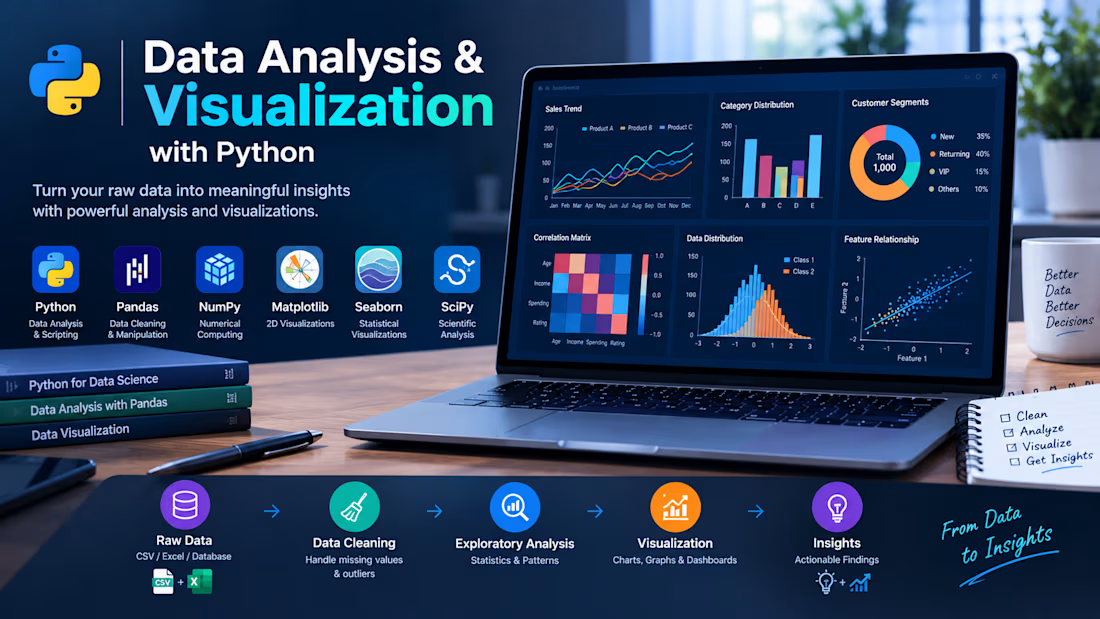
Data Analysis & Visualization with Python: Developed a Python-based data analysis workflow to transform raw datasets into meaningful insights through data cleaning, exploratory data analysis (EDA), statistical analysis, and visualization.
The workflow uses Python's data science libraries to organize datasets, identify patterns and trends, examine relationships between variables, and present findings through clear, informative charts and graphs. The goal is to make complex data easier to understand and support data-driven decision-making.
Key Features:
Data Cleaning & Preprocessing: Handle missing values, inconsistent entries, and data quality issues.
Exploratory Data Analysis: Investigate distributions, patterns, trends, and relationships within datasets.
Statistical Analysis: Calculate descriptive statistics and analyze correlations between variables.
Data Visualization: Create informative charts, graphs, and plots to communicate analytical findings.
Insight Generation: Summarize key observations in a clear and understandable format.
Reproducible Workflow: Use Python scripts and notebooks for transparent, repeatable analysis.
Technologies Used: Python · Pandas · NumPy · Matplotlib · Seaborn · SciPy


The network for creativity
Join 1.25M professional creatives like you
Connect with clients, get discovered, and run your business 100% commission-free
Creatives on Contra have earned over $150M and we are just getting started
Related posts

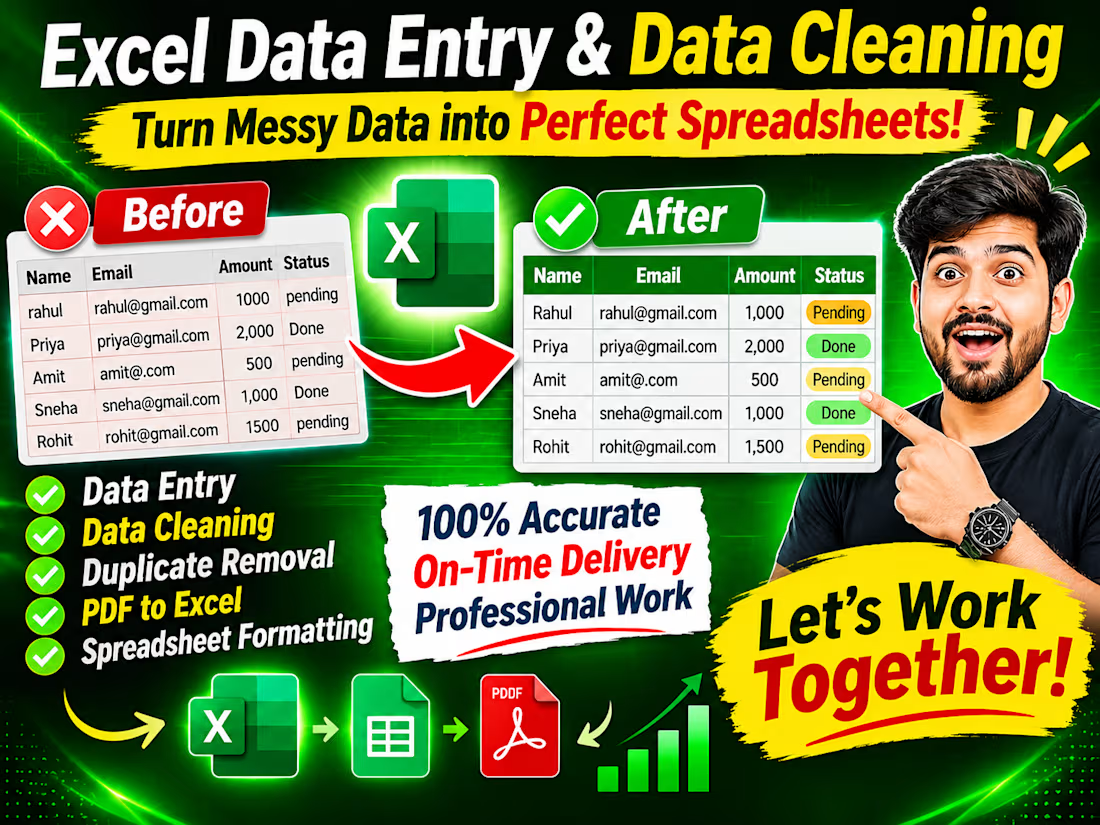
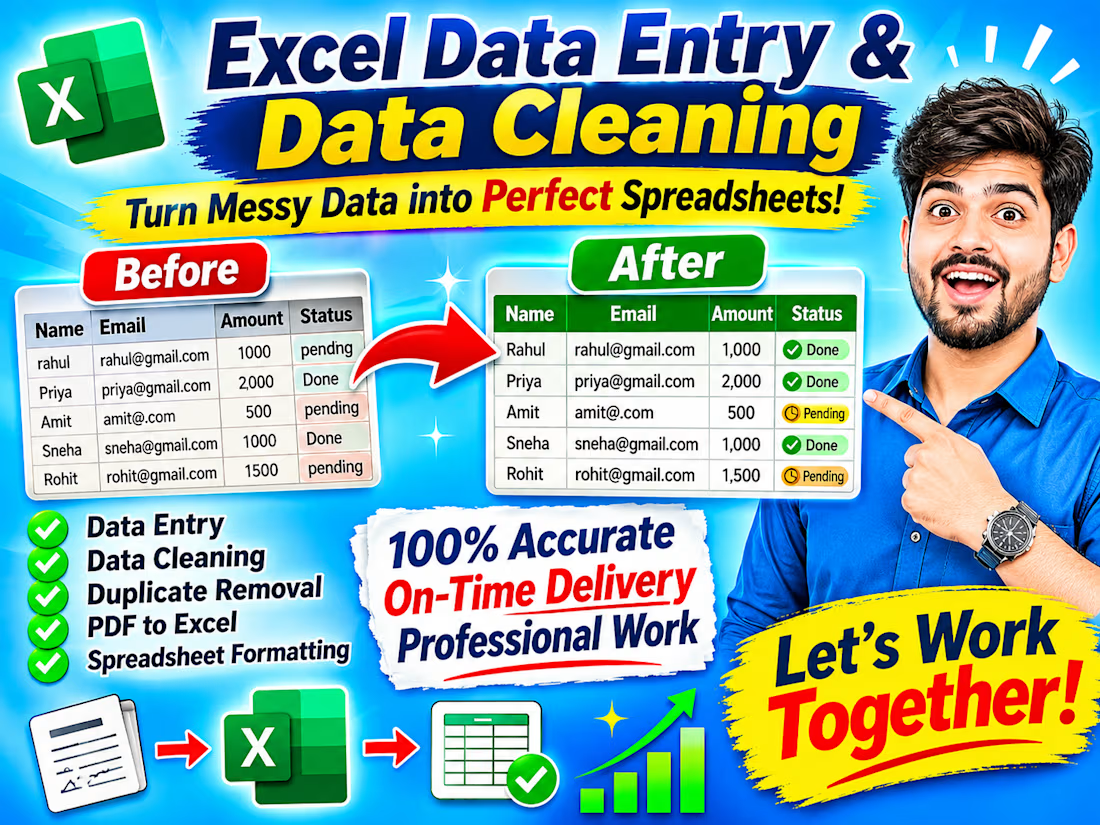
Excel Data Entry & Data Cleaning Specialist | Microsoft Excel #dataentry #datacleaning #dataformeting #299



AETHEL — THE SOLSTICE ENGINE
A celestial timepiece transforms into a 15-tier sapphire evergreen—reimagining seasonal luxury through haute horlogerie, architectural scale and procedural visual storytelling. A distinctive fusion of engineering, material science and cinematic imagination, challenging conventional holiday aesthetics.


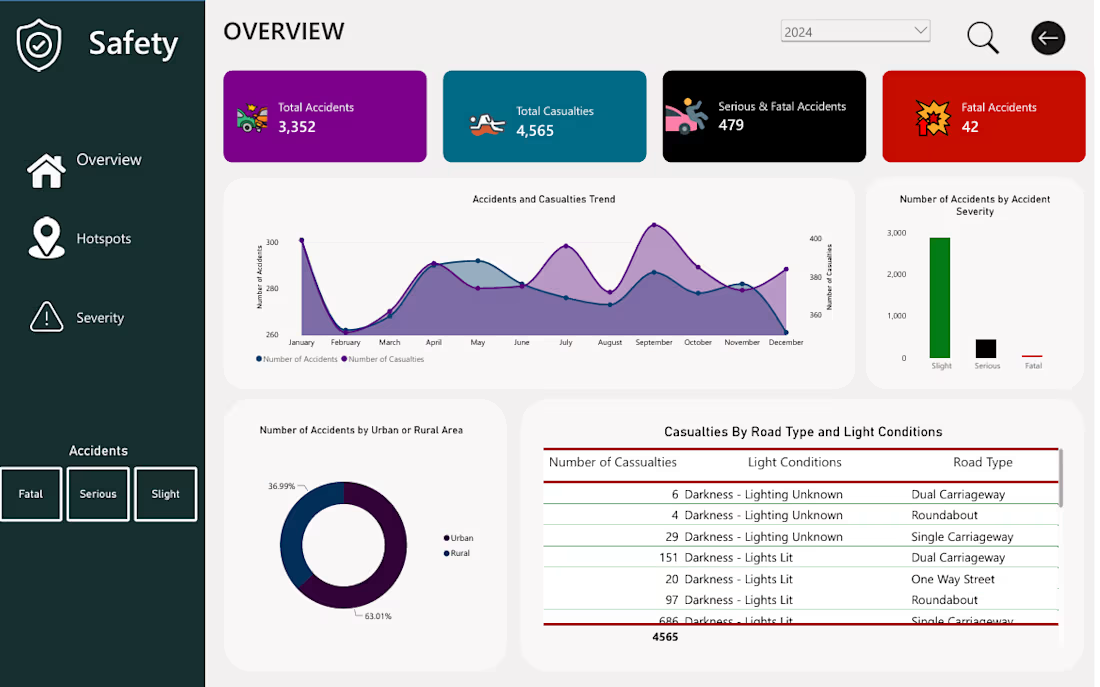
Road Safety Analysis | Python, SQL & Power BI
Developed an end-to-end road safety analytics project to help authorities understand accident patterns, identify high-risk areas, and make informed decisions about road safety interventions.
The project involved cleaning and preparing road accident data using Python and Pandas, followed by SQL-based exploratory analysis to investigate accident trends, casualty figures, severity distributions, and geographical patterns.
Using Power BI, I transformed the findings into an interactive dashboard featuring key performance indicators and visualisations that provide an overview of accident activity, highlight trends over time, and reveal differences in accident occurrence across districts and locations.
The analysis also explored accident severity in relation to road types, weather conditions, lighting, and road surface conditions.
Tools used: Python, Pandas, SQL, Power BI.
Project deliverable: An interactive Power BI dashboard supported by data cleaning, transformation, and SQL analysis.
The objective was to turn raw accident data into clear, meaningful insights that can support evidence-based road safety planning and resource prioritisation.