The network for creativity
Join 1.25M professional creatives like you
Connect with clients, get discovered, and run your business 100% commission-free
Creatives on Contra have earned over $150M and we are just getting started
Back to feedPost
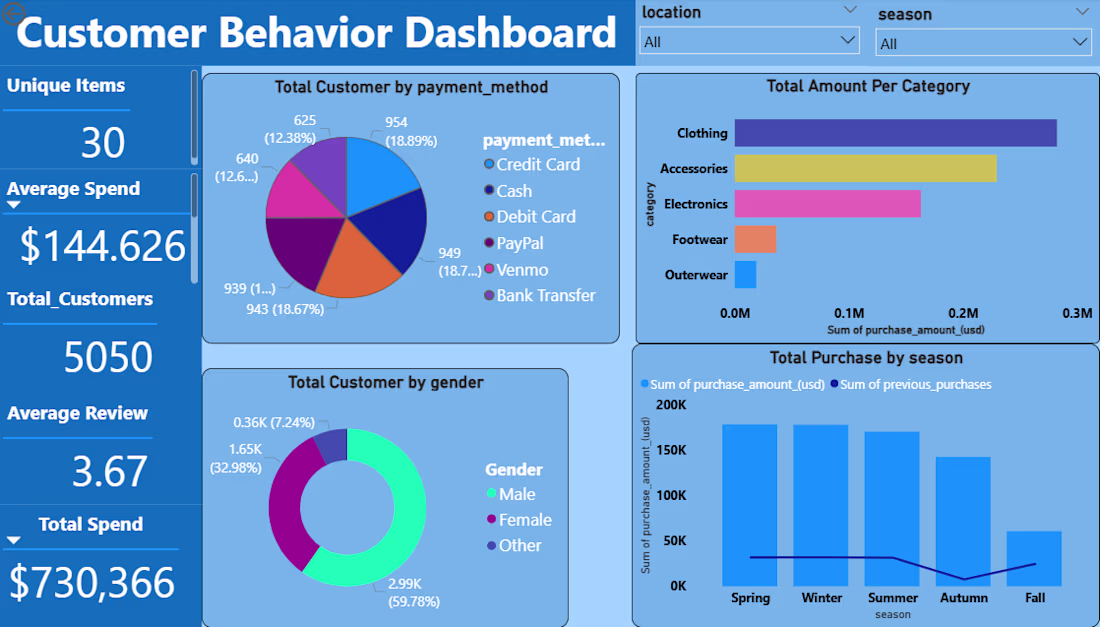
The Customer Behavior Dashboard is an interactive Power BI dashboard designed to analyze customer purchasing patterns and business performance. The data was cleaned and transformed using Python (Pandas and NumPy), stored and queried using PostgreSQL and SQL, and visualized in Power BI. The dashboard shows key metrics such as Total Customers (5,050), Total Spend ($730,366), Average Spend ($144.63), Average Review (3.67), and Unique Items (30). It provides insights into customer payment preferences, gender distribution, category-wise sales, and seasonal purchasing trends. The analysis reveals that Clothing generates the highest revenue, male customers represent the largest customer segment, and Spring and Winter experience the highest purchase activity. Interactive filters for location and season allow users to explore customer behavior dynamically and support data-driven business decisions.
The network for creativity
Join 1.25M professional creatives like you
Connect with clients, get discovered, and run your business 100% commission-free
Creatives on Contra have earned over $150M and we are just getting started
Related posts
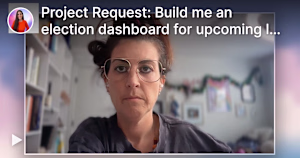
I want to create this really cool local dashboard that would have true meaning and purpose for residents of Pompano Beach.
I recorded a Tella to explain with examples, which I sent to a few people, but I'm waiting to hear back.
If there are any devs, vibe coders or techies or just someone not a writer like me, lol, could tell me who I need (skillset wise) and if they have any recommendations -- affordable and efficient -- this is an MVP. :))) And this is not something I'll profit off of btw. :)
Please message me if you don't mind watching my video and guiding me in the right direction. I'm pretty psyched about it. :D
Link to Video >
tella.tv
Project Request: Build me an election dashboard for upcoming local commission election. — Tella
I’m looking for help in developing a strategic plan (execution mainly) for an upcoming local commissioner election in Pompano Beach, Florida.
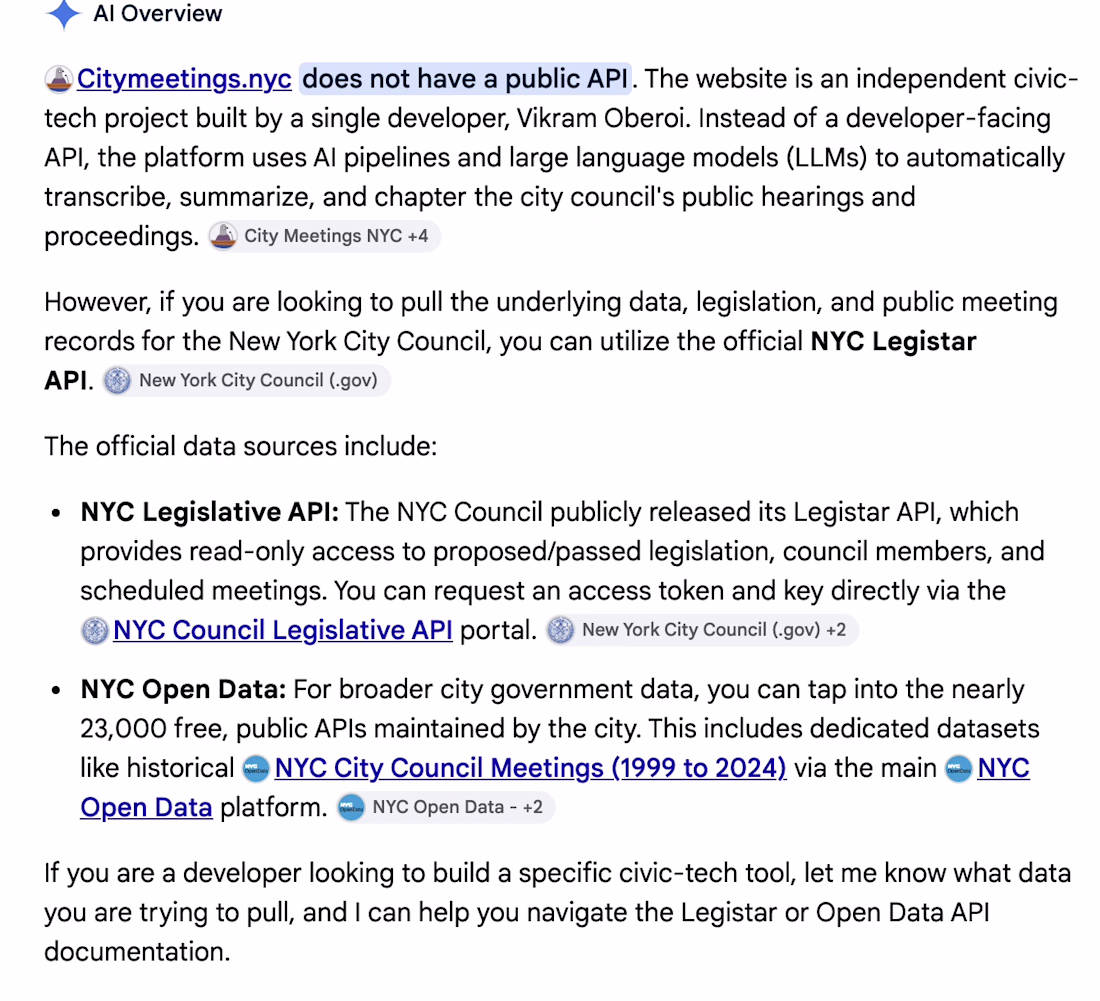
citymeetings.nyc is similar, and this is how they did it.
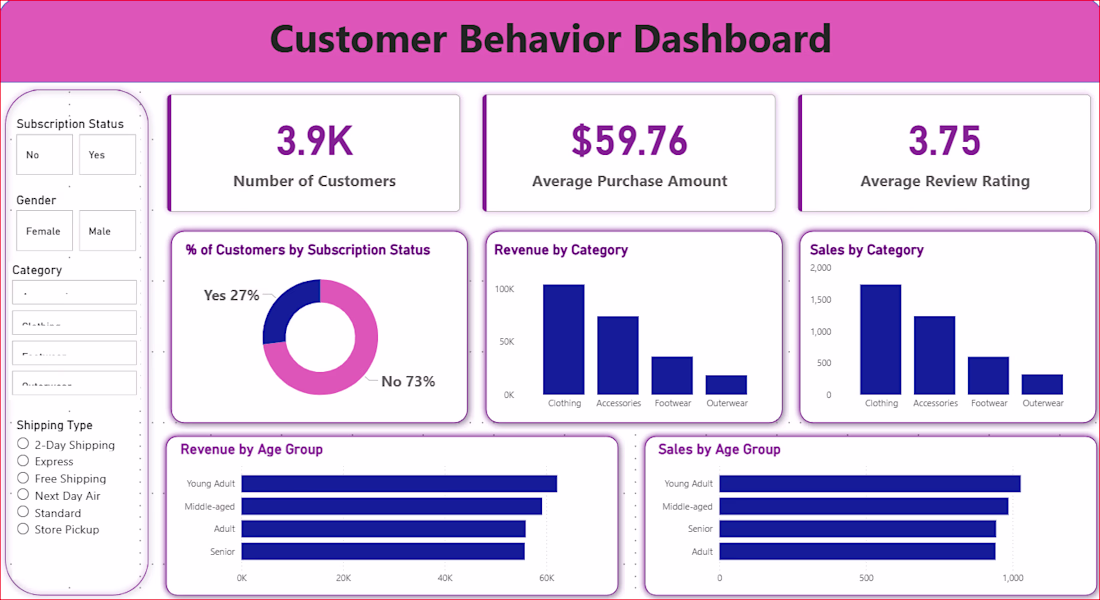
Tittle: Customer Shopping Behavior Analysis
Tools : Python, PostgreSQL, Power BI, EDA
Description: Explored 3,900+ retail transactions to uncover buying patterns, peak sales periods, and high-value customer segments. Delivered a Power BI dashboard and SQL-backed data model for business decision support.
Link : https://github.com/iabbaszaidi/Customer_data_analysis
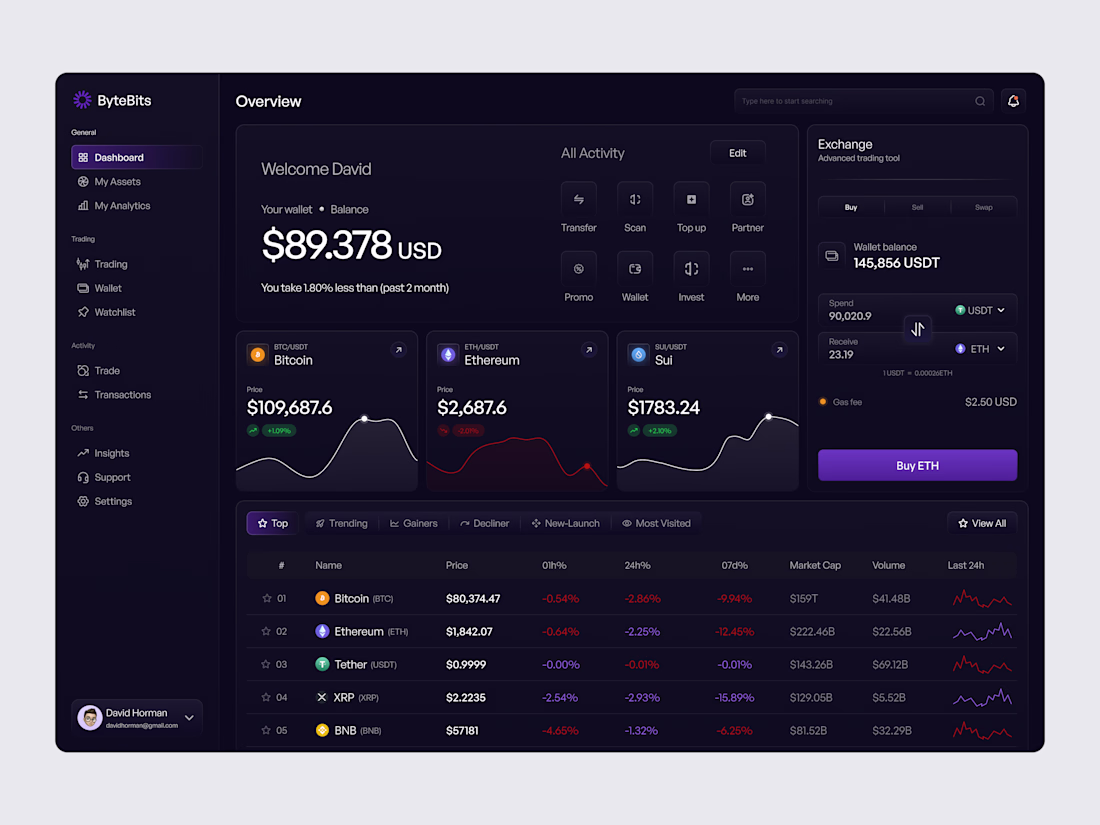
Designed a modern crypto dashboard that turns complex data into actionable insights.
Clean UI. Real-time analytics. Better decisions.
#Web3 #DashboardDesign #UXDesign
Challenges
View allTrending
Claude
Claude has entered the design space. How are you using Claude Design?
Contra University
Learn from expert creatives how to earn more using next-gen AI tools.
MagicPath
The canvas is infinite, and exploration is becoming the workflow. How are you using MagicPath?
creativeaiflow
Creative AI workflows are evolving. What tools do you use, and what are their strengths and weaknesses?
freelancerlife
Freelancer life is wins, pivots, and everything in between. What’s yours right now?