The network for creativity
Join 1.25M professional creatives like you
Connect with clients, get discovered, and run your business 100% commission-free
Creatives on Contra have earned over $150M and we are just getting started
Back to feedPost

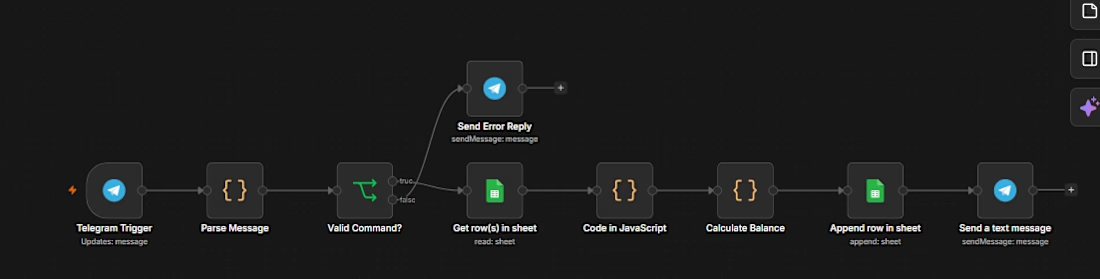
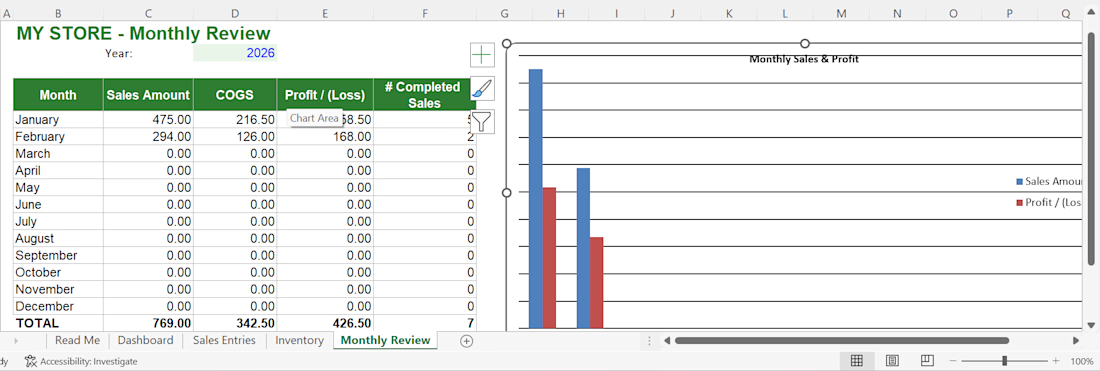
Auto-logs expenses via Telegram, tracks balance, updates Google Sheets — no manual entry. Built early on, before Claude Code. First step toward of my learning experience in the ai industry.


The network for creativity
Join 1.25M professional creatives like you
Connect with clients, get discovered, and run your business 100% commission-free
Creatives on Contra have earned over $150M and we are just getting started



Related posts

Starter Tier Project
Project name (100 characters limit)
Starter E-Commerce Sales & Inventory Dashboard

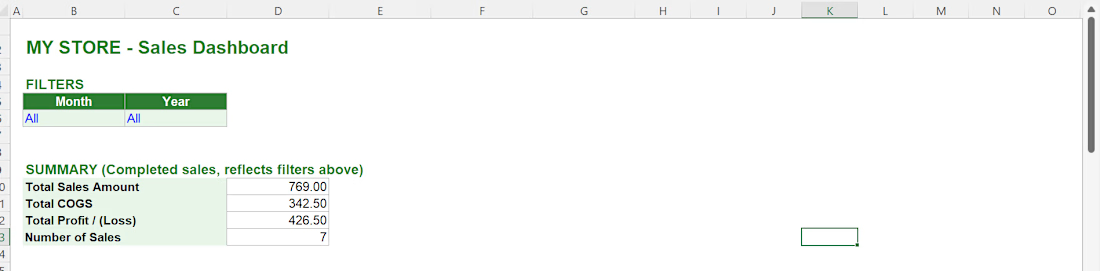
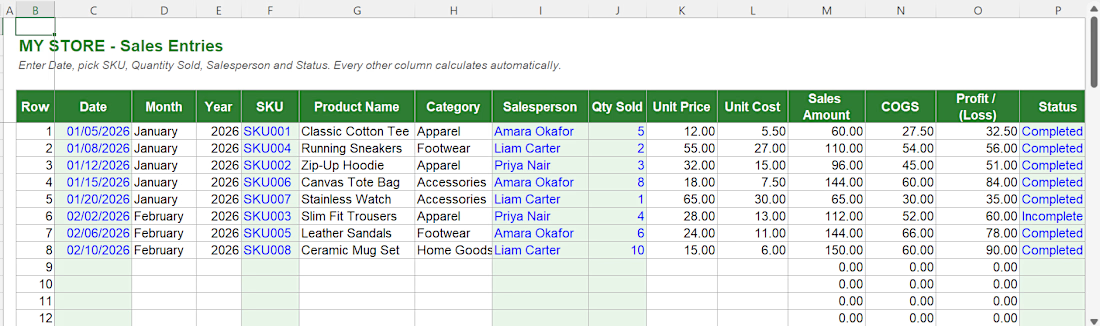
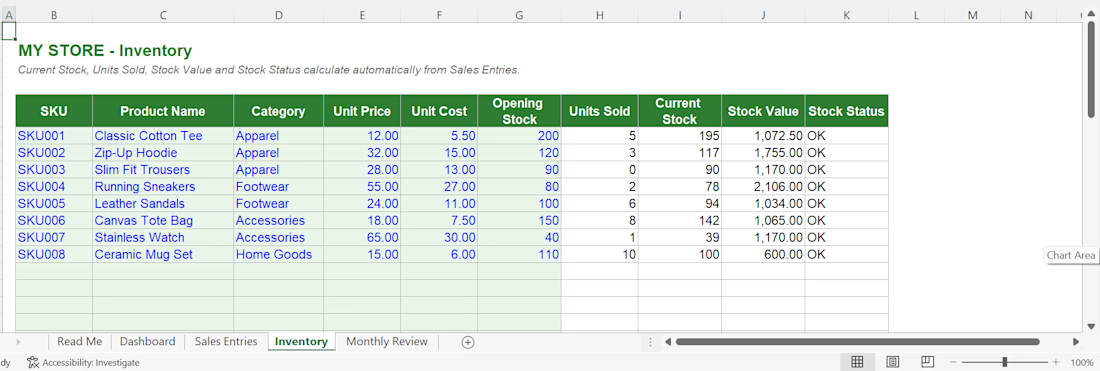

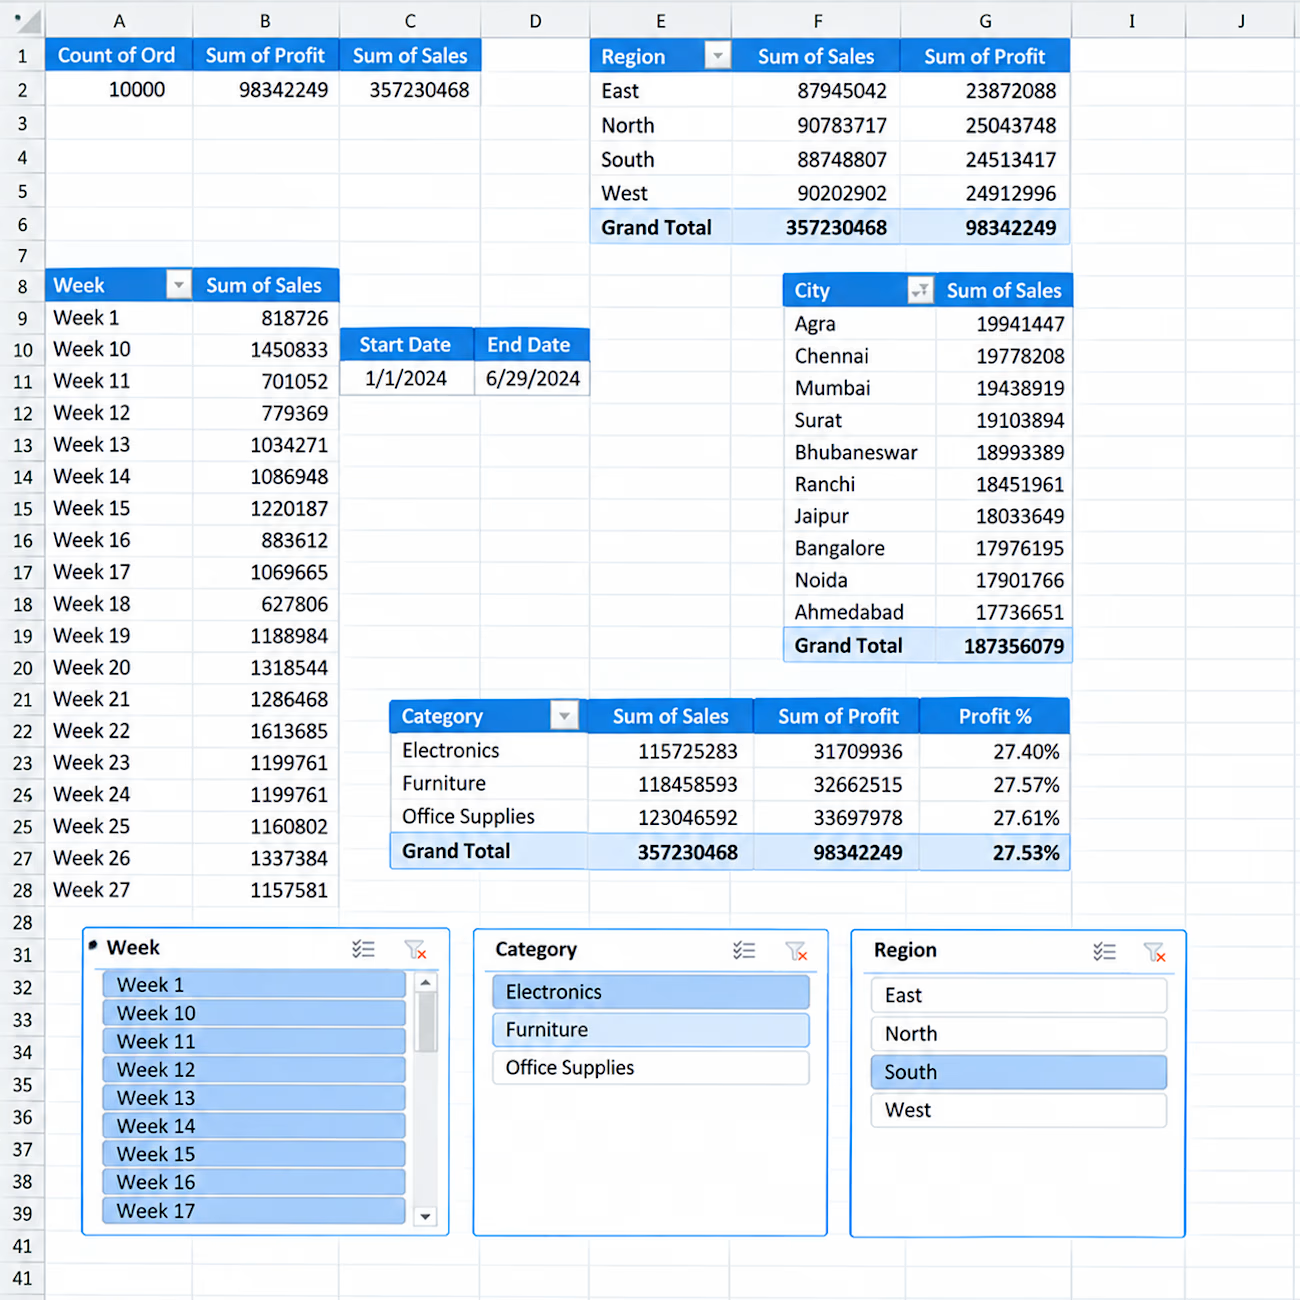
📊 Interactive Sales Analytics Dashboard in Excel
I created an interactive Excel dashboard to analyze sales performance across different business dimensions.
Key Insights & Features:
• Total Orders, Sales & Profit KPIs
• Sales & Profit by Region
• Sales by City
• Category-wise Sales, Profit & Profit %
• Weekly Sales Analysis
• Interactive Slicers for Week, Category & Region
• Start Date & End Date tracking
• PivotTable-based analysis
This dashboard is designed to turn raw sales data into clear and actionable business insights using Excel.

Hello.
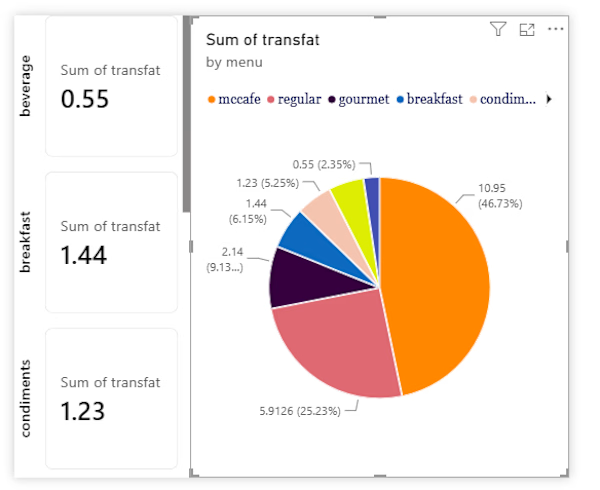
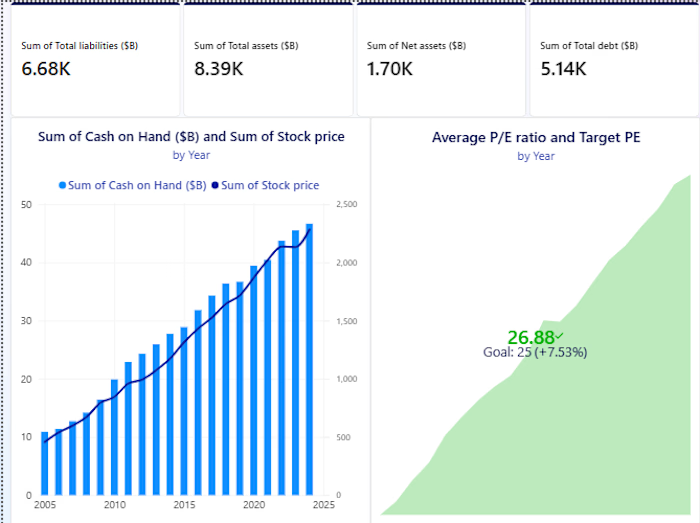
I guess we're in the same page about data analysis and visualization

Been working on a Web3 payment platform lately.
Built the wallet, token, payment, invoice, payment request, payment page, network, and transaction history flows.
Still polishing the product and learning a lot along the way.
Next up: blockchain analytics. 🚀

cool I would like to check out the platform when you launch it!