
Camilo Rojas
Power BI | SQL | Python | Business Intelligence
New to Contra
Camilo is building their profile!
Sales
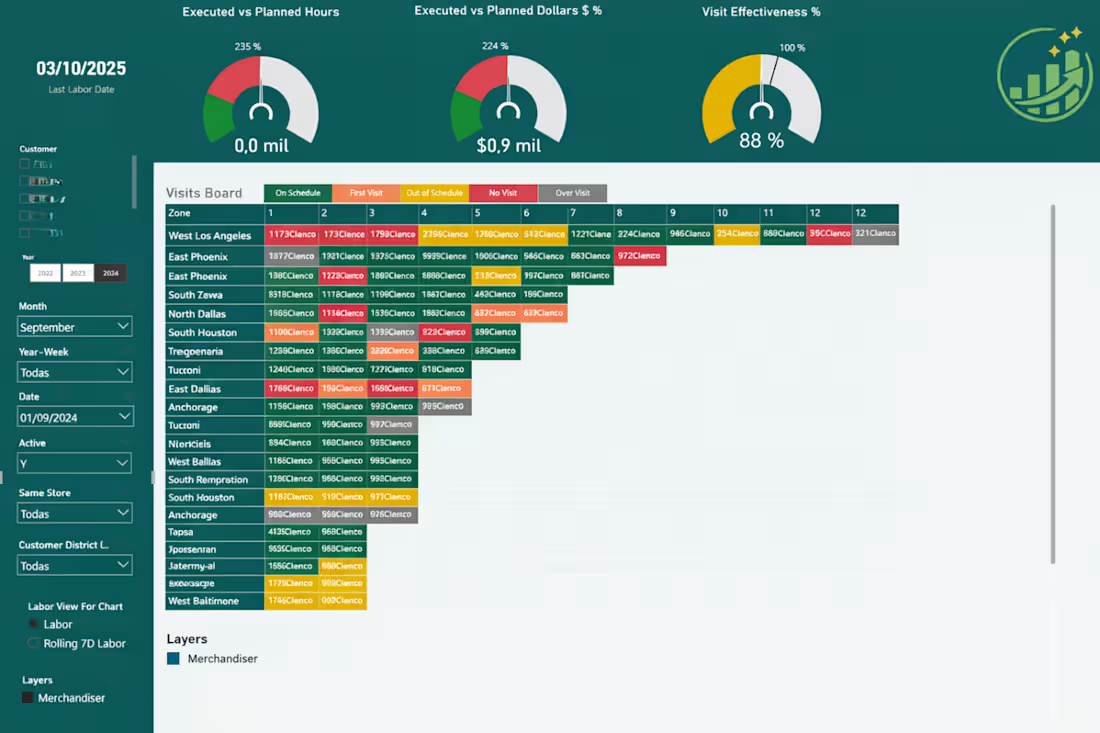
Team Performance Dashboard – Power BI:
Designed an
interactive Power BI dashboard to monitor sales team performance across
multiple store visits in the United States.
The dashboard tracks key metrics such as store coverage, visit frequency, sales performance, and productivity indicators.
It allows managers to quickly identify high-performing merchandisers, detect coverage gaps, and make data-driven decisions to improve field operations.
1
21
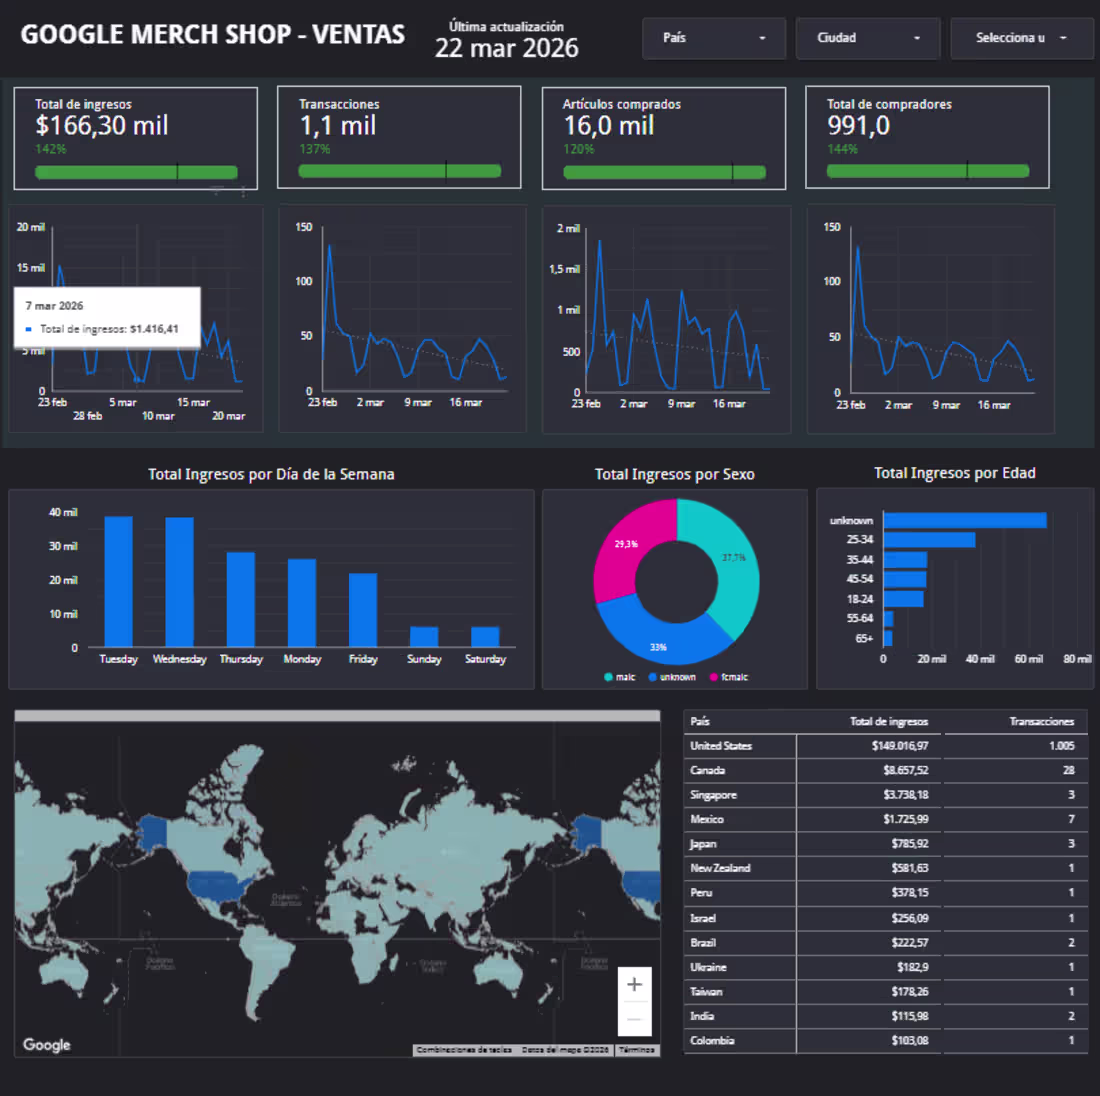
Sales Performance Dashboard - LOOKER STUDIO:
Developed interactive dashboard in Looker Studio that analyzes the performance of Google Merch Shop Sales across different dimensions such as, time, location, days, etc.
1
2
55

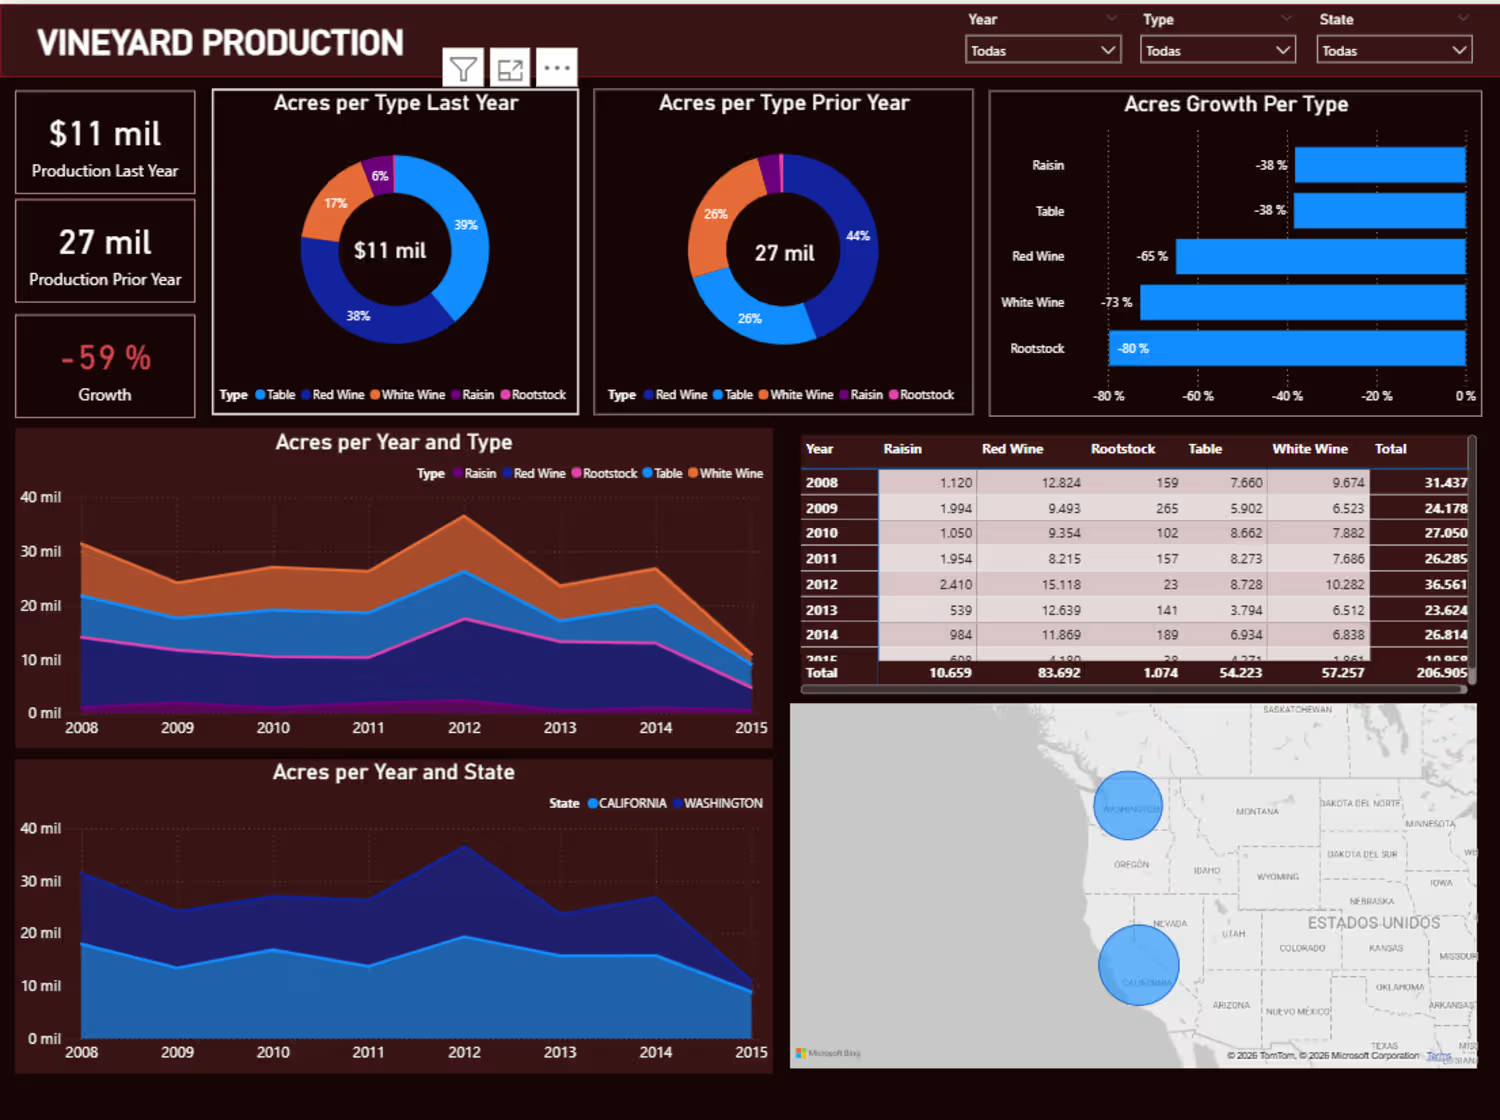
Productivity Dashboard - Power BI:
Developed interactive Dashboard in Power BI that analyze the productivity of a vineyard across different dimensions, such as time, location, etc
1
27
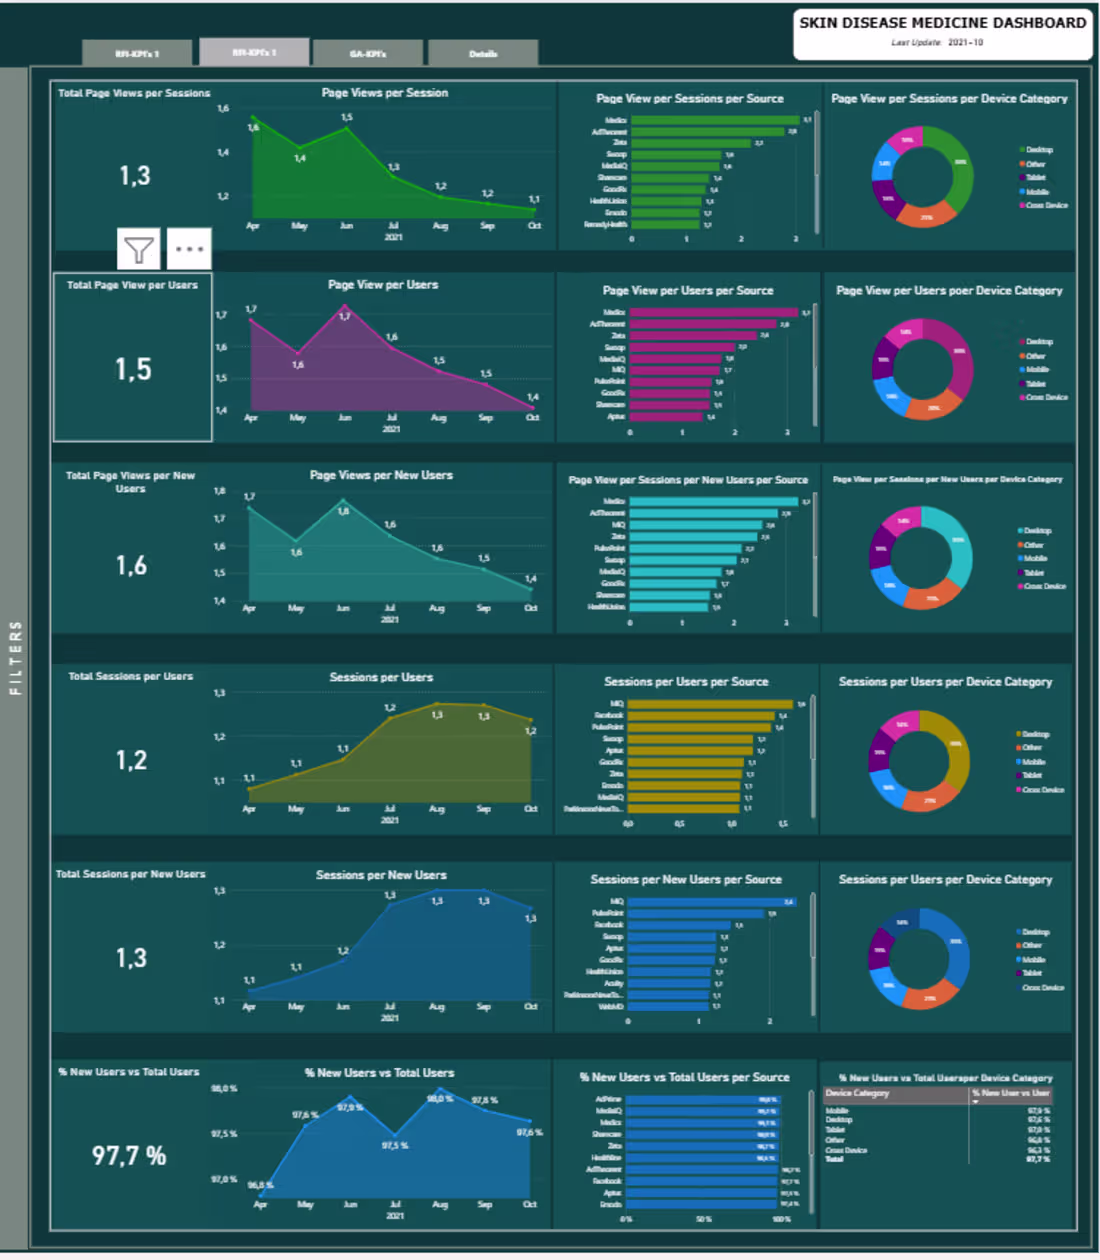
Digital Performance Dashboard - Power BI:
Developed dashboard that analyzes the impressions of a particular website across multiple dimensions, such as Page Views, Sessions, Users, etc.
2
42