
Ashmal Irshad
Data analyst who finds the $ in your data — Python, SQL & Po
New to Contra
Ashmal is building their profile!
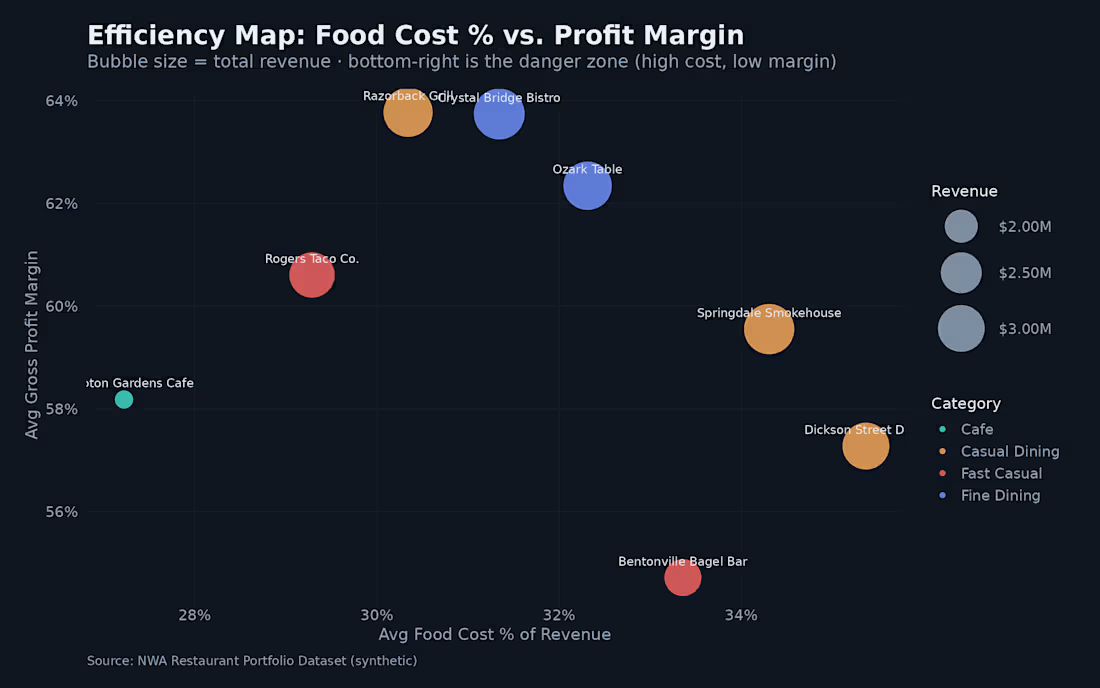
Turning Arkansas's Restaurant Data Into Revenue Decisions
Northwest Arkansas is one of the fastest-growing regions in the country — but growth doesn't fix a blind spot. Most local restaurants and small businesses are sitting on years of POS, labor, and marketing data they've never actually looked at. They know what happened. They don't know why, or what to do next.
I built a full analytics engagement — from raw data to boardroom-ready dashboard — for a simulated 8-location NWA restaurant group spanning Fayetteville, Bentonville, Springdale, and Rogers. The goal: turn 5,800+ store-days of transaction data into decisions an owner could act on in a week.
What the analysis uncovered:
A $2.9M growth trap: marketing spend was up 31% while repeat customer rate quietly fell from 60% to 48% — acquisition was masking a retention problem
A 9-point margin gap between the best and worst-performing location, driven almost entirely by food cost % and labor efficiency, not revenue size
Clear seasonal and day-of-week demand patterns that were never being staffed or purchased against
What I delivered:
A complete analytics stack — Python + R exploratory analysis, an executive Power BI dashboard, and a plain-English insights report using my DATA Framework™ (Discover → Analyze → Translate → Automate) — built to be handed straight to an owner, not just a data team.
This is the exact process I run for small businesses across Arkansas: you have the data already. I turn it into decisions that protect margin and stop growth from quietly leaking out the back door.
Have a business with data sitting in spreadsheets, your POS, or QuickBooks? Let's find out what it's telling you. Message me for a free 15-minute Data Health Check — I'll show you one insight from your own numbers before you commit to anything.
1
4
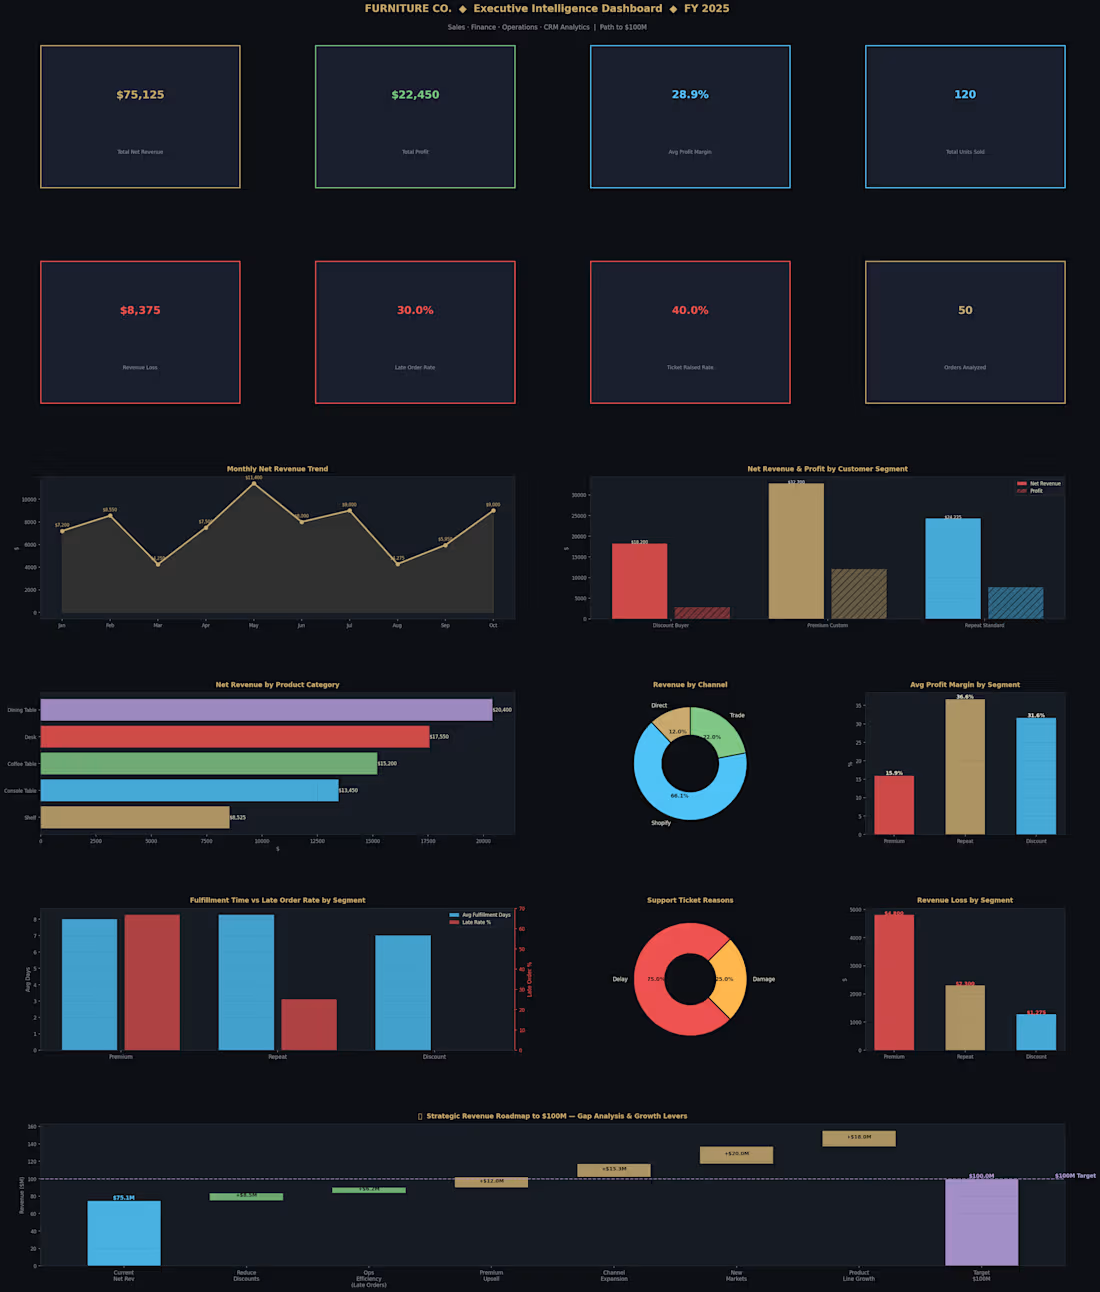
Built an end-to-end Furniture Sales & Financial Analytics Dashboard by transforming raw sales data through Python data cleaning, modeling, and forecasting. Identified high-performing products and revenue opportunities through interactive Power BI visualizations, enabling stakeholders to make data-driven decisions around product strategy, inventory optimization, and future revenue growth
0
13
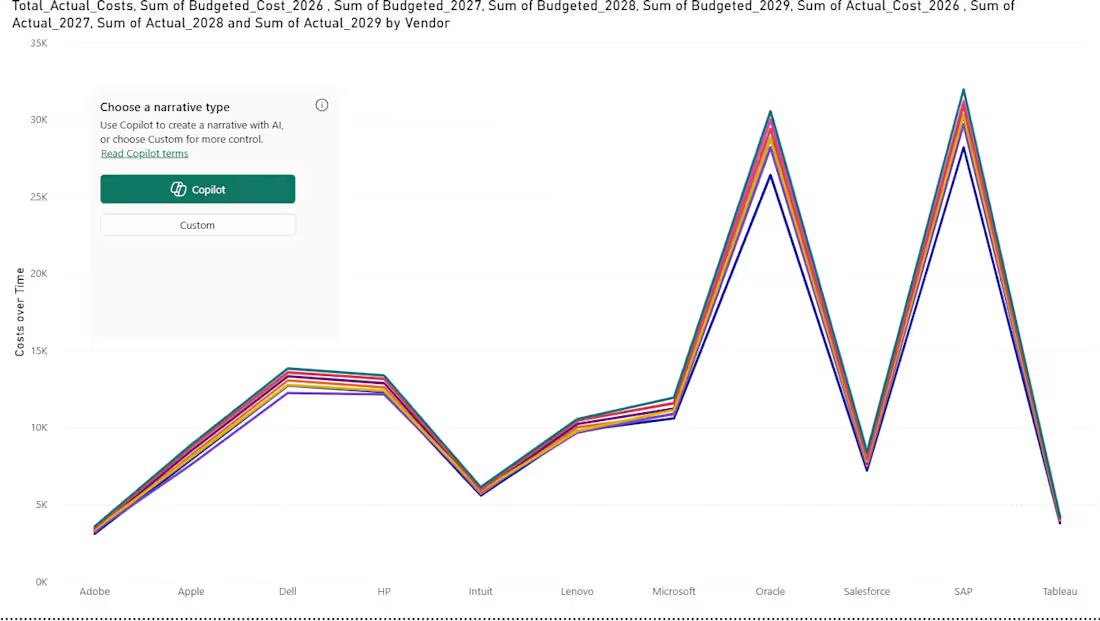
I started by gathering vendor budget and actual cost data from multiple sources. After consolidating the data, I used Power Query to clean inconsistencies, remove duplicates, standardize fields, and validate financial accuracy. I then built a relational data model and created DAX measures for total costs, budget variance, and year-over-year trends. Finally, I developed an interactive Power BI dashboard that allowed stakeholders to analyze vendor spending patterns, identify cost drivers, and compare actual performance against planned budgets. The final product transformed manual spreadsheet reporting into a scalable decision-making tool
0
17
Using a real-world financial dataset, I combined the following learning techniques:
🔹 K-Means Clustering (Segmentation)
Cleaned and preprocessed data (handled missing values, encoded categorical variables).
Scaled features using StandardScaler for balanced clustering.
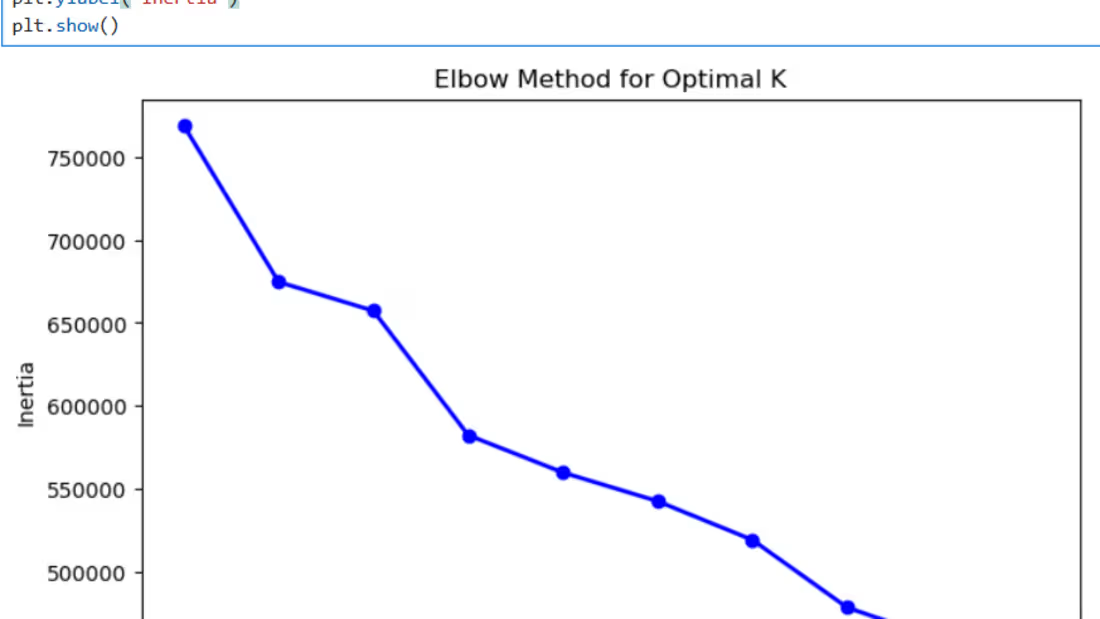
Determined optimal K using the Elbow Method.
Key Takeaways:
Logistic Regression 89.1%: Strong baseline performance, interpretable relationships.
Random Forest Classifier 90.5%: Higher accuracy, better recall for positive cases, and robust feature importance insights.
Top Predictors:
Customer duration, balance, and age had the strongest influence on predicting deposit subscriptions.
📈 Impact:
Using insights from both segmentation and classification, firms can:
🎯 Personalize offers and campaigns based on customer profiles.
💸 Reduce marketing costs by 15–20% via targeted outreach.
🤝 Improve retention rates by 10%+ through data-driven engagement.
This project demonstrates how data science bridges customer understanding and business outcomes, moving decision-making from intuition to evidence.
What I enjoyed most was seeing how machine learning insights can directly translate into optimized marketing and satisfied customers!
0
24