
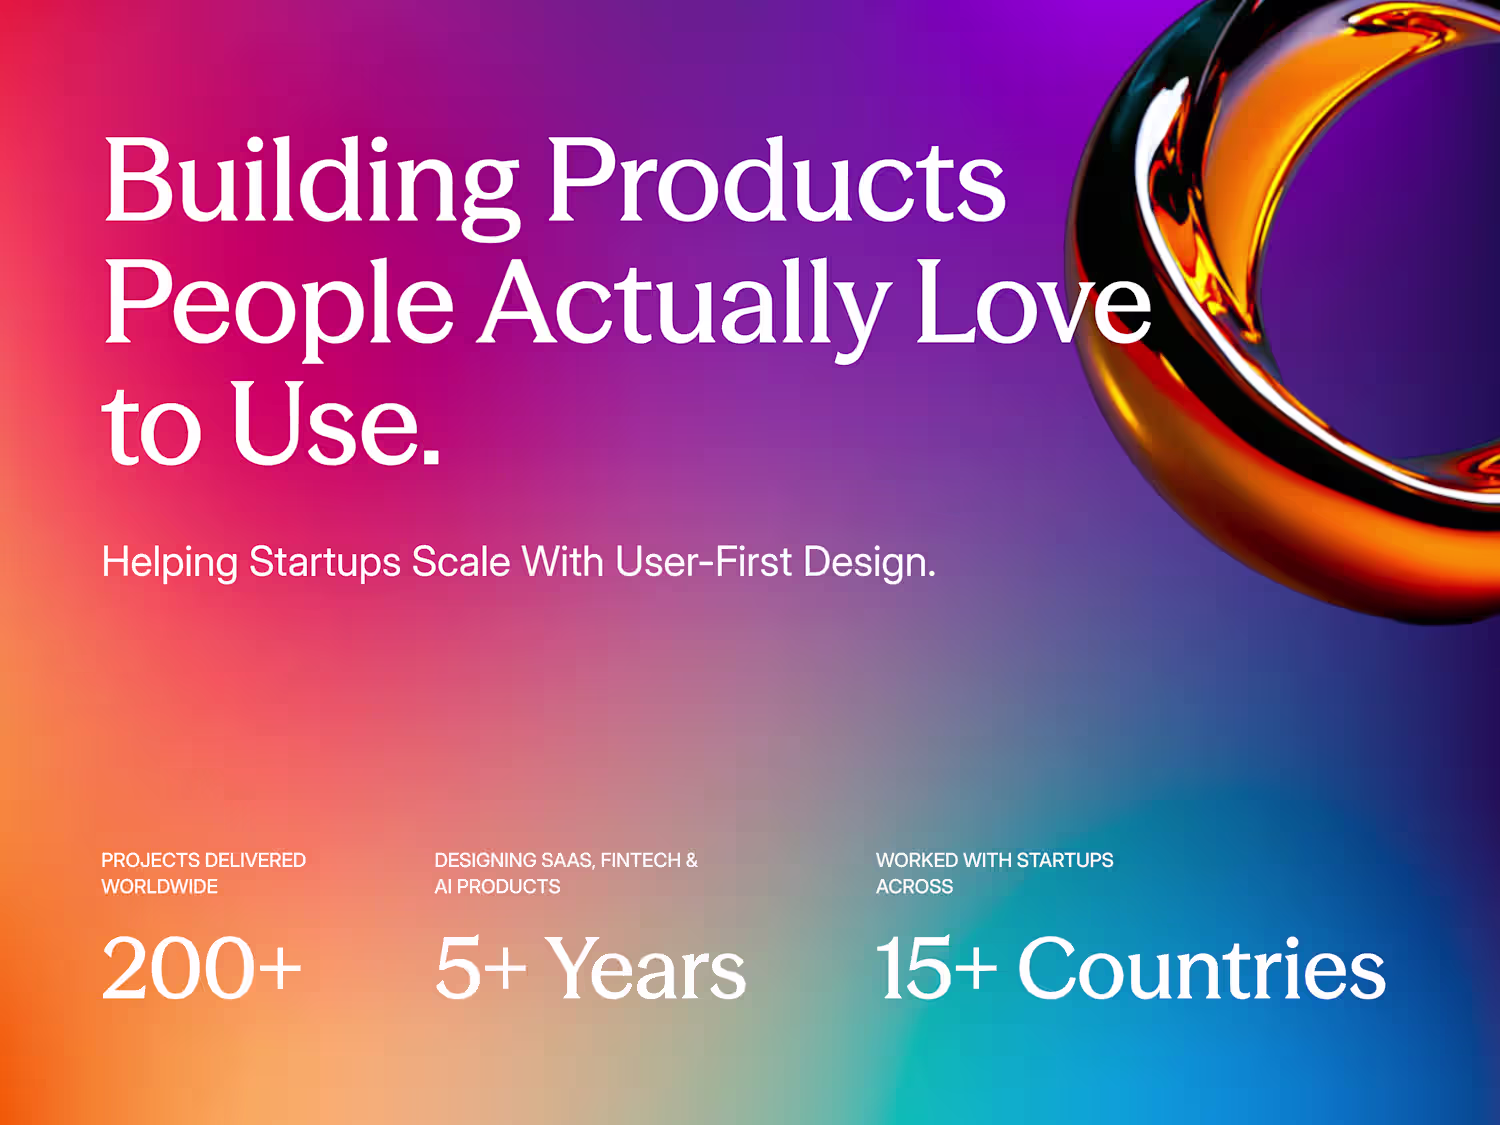
Arafat Ovi
UX/UI Designer helping SaaS brands
Ready for work
Arafat is ready for their next project!
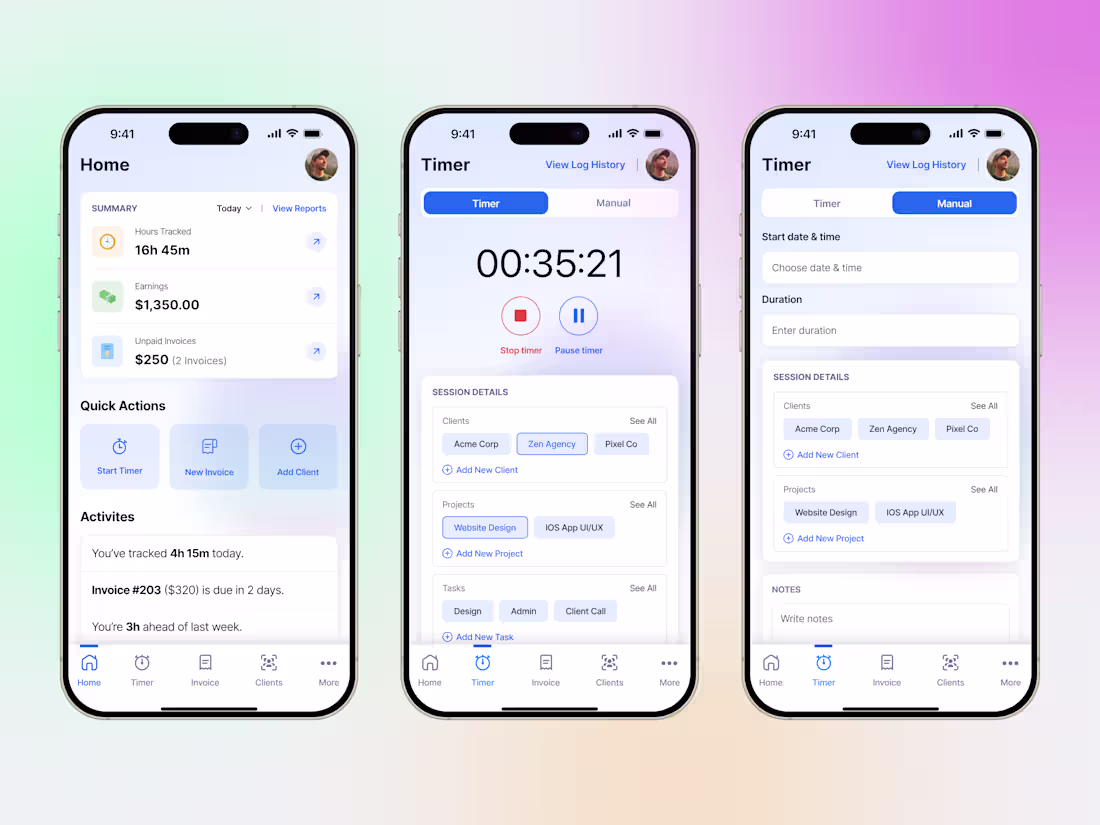
Time Tracker and Invoicing App for Freelancers 💫
0
72
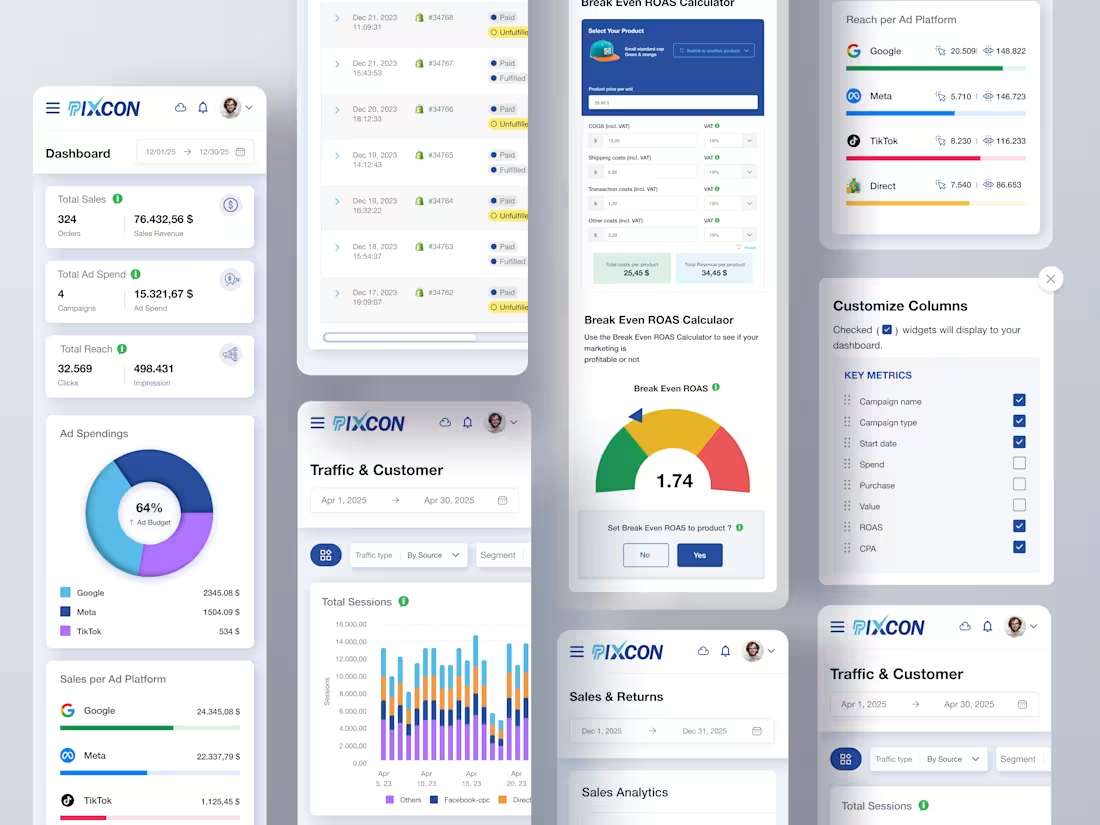
Mobile version of Ecommerce store analytics SaaS
0
55
SaaS E-Commerce Store Analytics Tool
Pixcon is a performance analytics platform for online stores, built to simplify marketing and sales tracking through clean visual hierarchy.
The goal was to make data intuitive, actionable, and beautiful — turning complex KPIs into quick insights.
Challenges:
Displaying dense analytics without clutter.
Solutions:
Used modular grids, accessible color contrast, and data-driven widgets to deliver a smooth, conversion-focused dashboard experience.
3
80
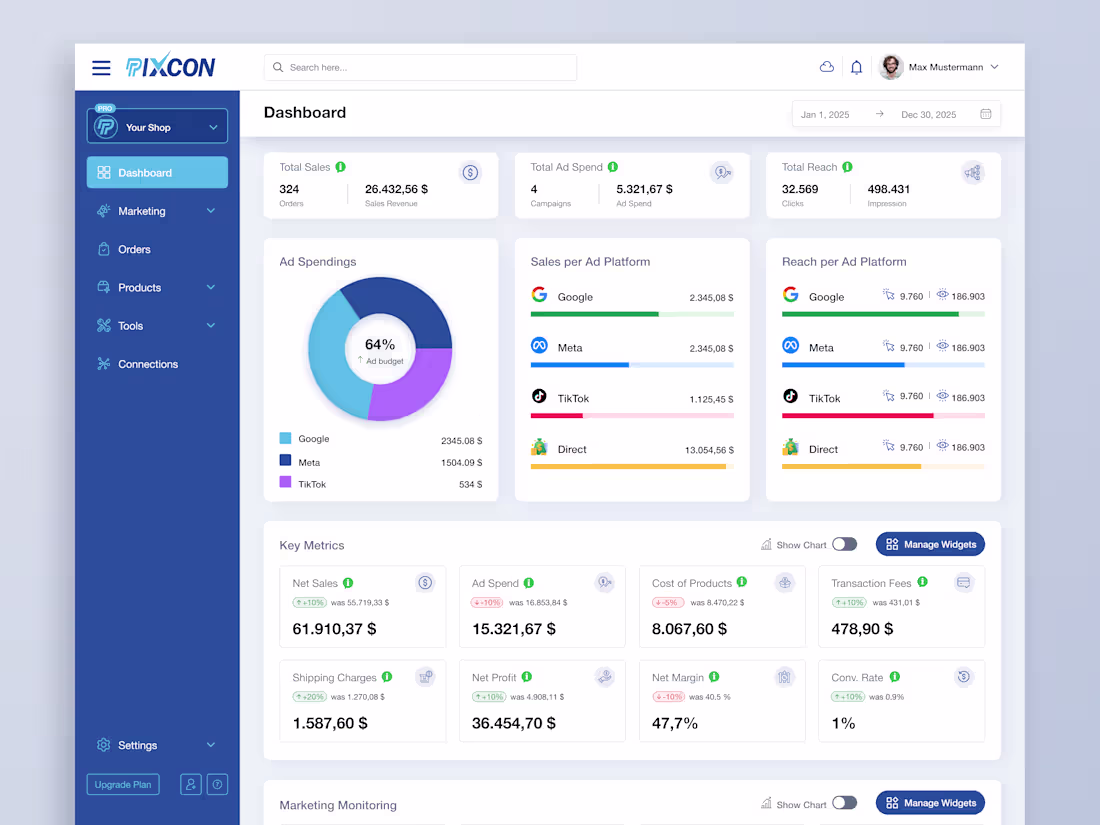
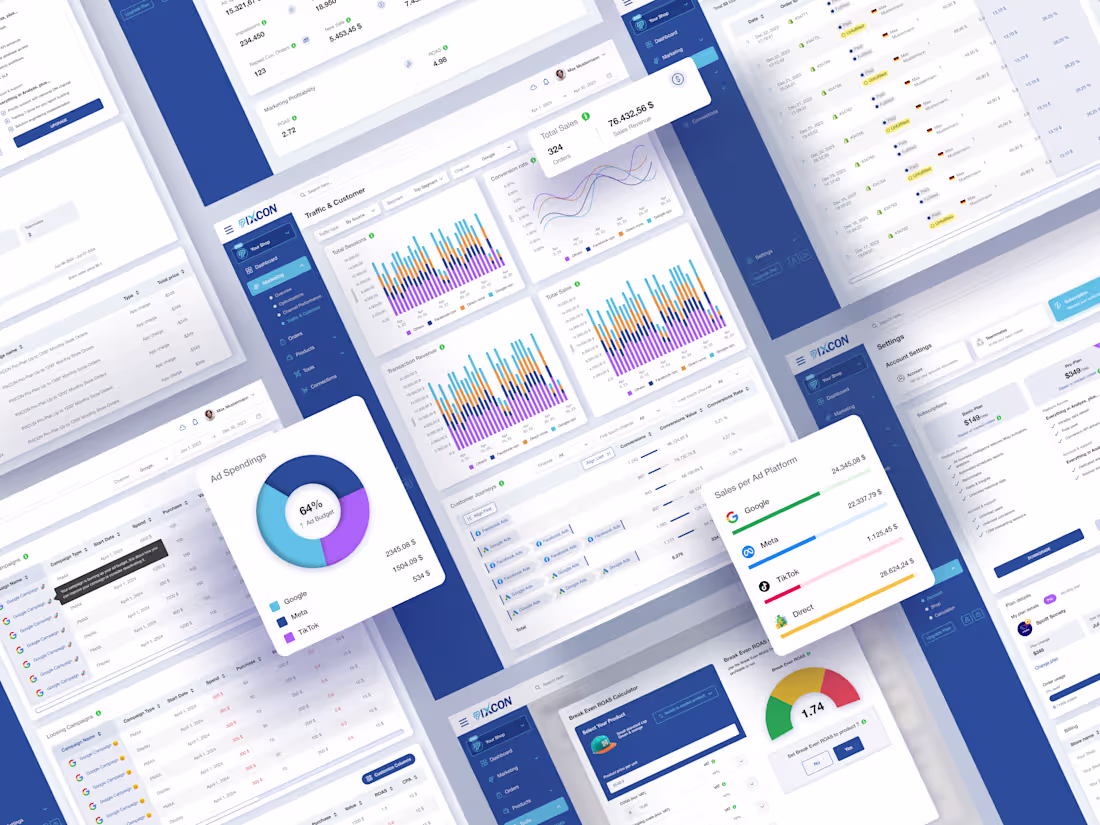
Online Store Analytics Dashboard
Designed a clean analytics dashboard for eCommerce brands — improving data visibility, ad insights, and sales tracking efficiency.
It helps online store owners track ad performance, revenue, and campaign metrics in one intuitive view.
The goal was to create a clear, structured interface that simplifies decision-making for business owners.
Challenges:
Presenting large sets of marketing data without clutter or cognitive overload.
Solutions:
Used modular cards, visual hierarchy, and clear color coding to highlight key metrics — improving data readability and user engagement across devices.
1
2
68
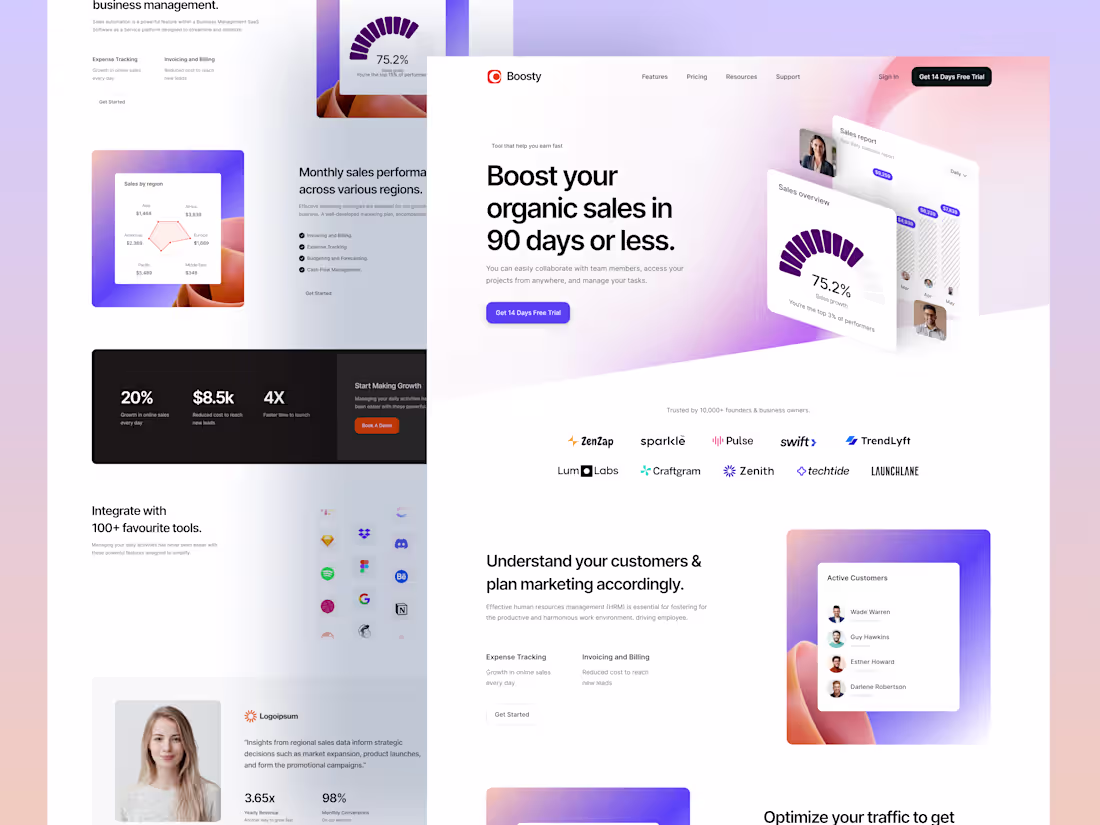
A high-converting Sales Performance SaaS Landing Page UI for Boosty — a platform that helps teams boost organic sales in 90 days or less. Designed with clean layouts, gradient accents, and trust-driven elements to engage users, highlight results, and drive free-trial conversions.
Challenges: 👇
Designing a B2B SaaS website that visually demonstrates business growth and ROI without overwhelming users.
Creating a layout that quickly communicates key product outcomes (organic sales boost, analytics, integrations).
Solutions: 👇
Designed a bold, gradient-driven hero section with measurable proof (“Boost your organic sales in 90 days or less”).
Added analytics previews (sales overview + performance charts) to showcase real data insights.
Integrated trusted-by logos, case studies, and conversion stats to validate performance.
44
99
741
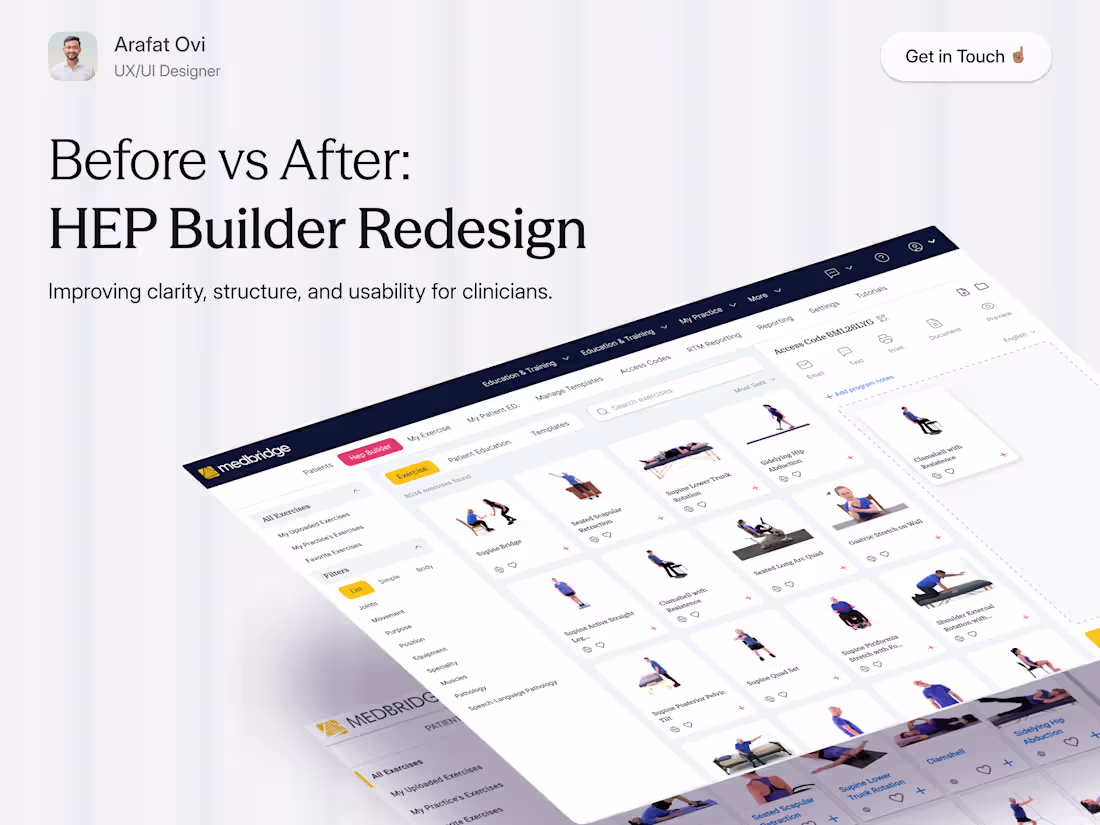
Before vs After: HEP Builder Redesign
Reimagined a complex clinician dashboard into a clear, structured, and efficient experience.
The goal: make building and managing exercise programs effortless through improved hierarchy, accessible visuals, and smooth navigation.
This redesign highlights how thoughtful UI decisions can simplify workflows and create real impact for healthcare professionals.
💡 Looking for a UX/UI Designer to modernize your product? Let’s collaborate, I specialize in turning outdated systems into high-performing, user-friendly experiences.
1
3
117
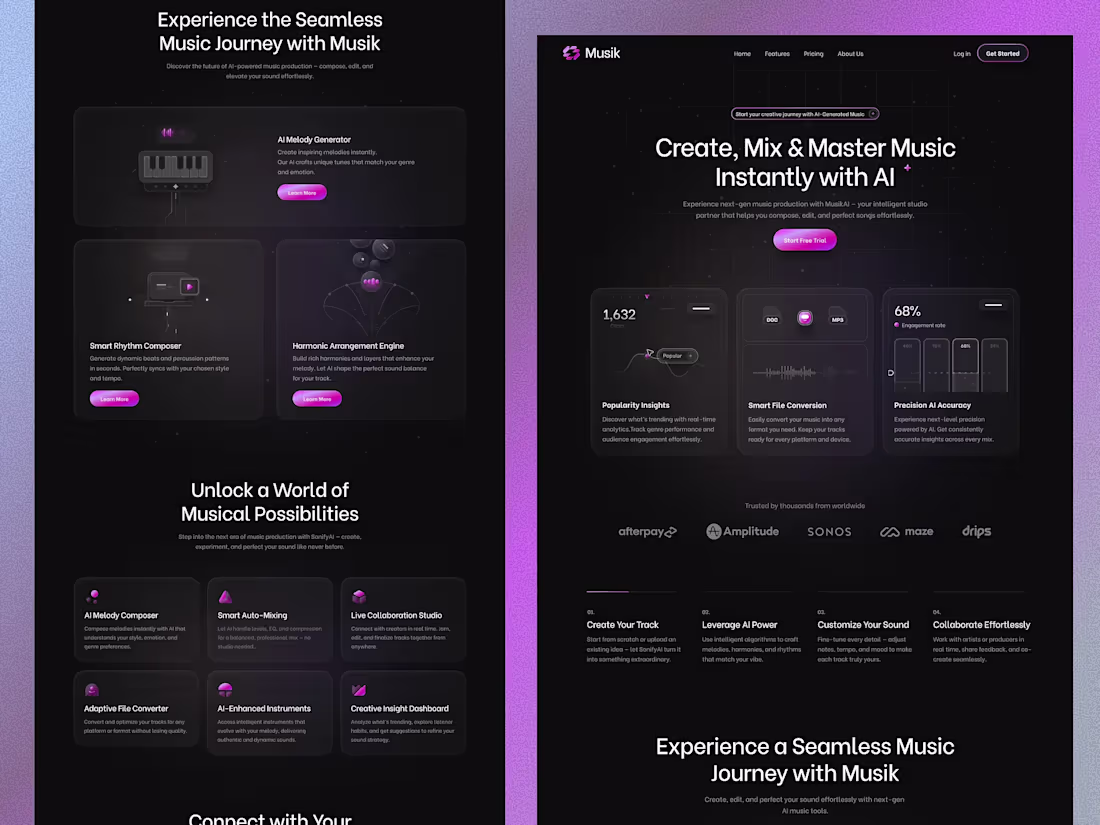
AI-Powered Next-Gen Music Creation Platform
AI-powered music production platform - designed for clarity, flow, and immersive creativity through sleek dark-mode UI.
Musik reimagines music creation with AI - enabling users to compose, mix, and master effortlessly. The goal was to craft an intuitive, visually rich interface that balances advanced AI tools with creative simplicity.
Challenges: 👇
Presenting complex AI features without overwhelming users.
Solutions: 👇
Used modular layouts, glowing accents, and structured grids to create a seamless, futuristic experience that feels both powerful and human.
2
46
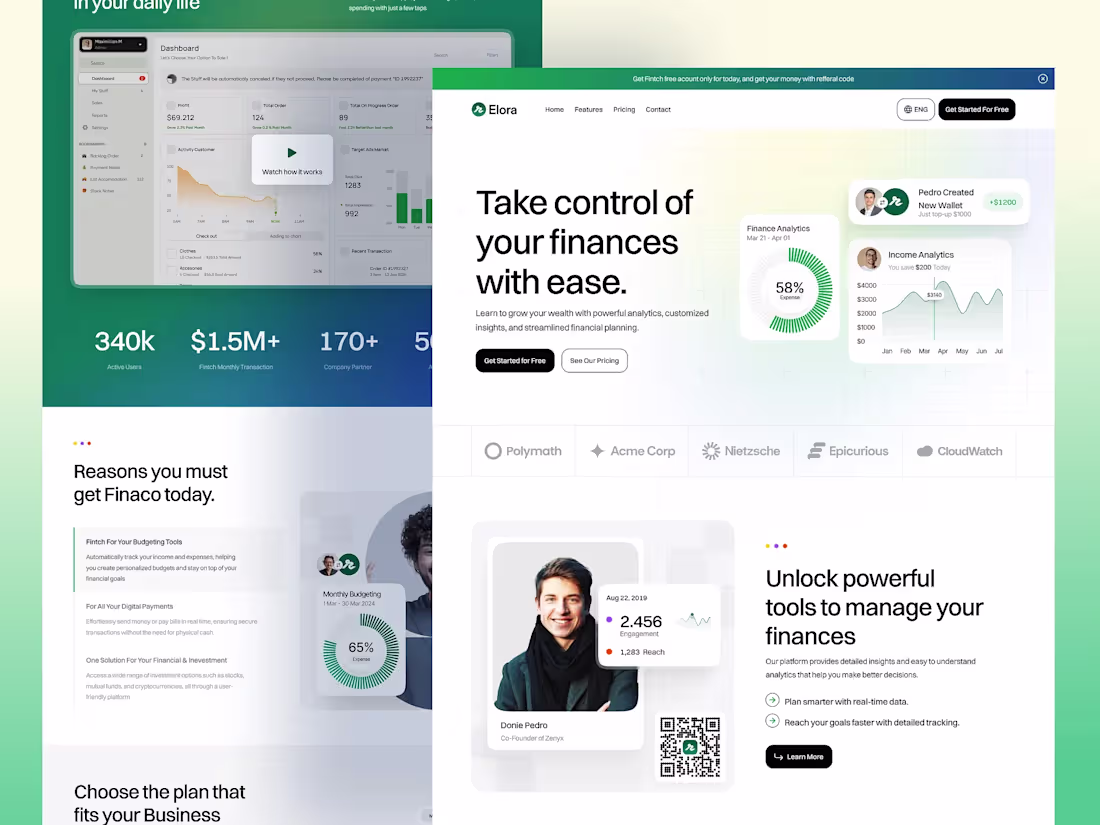
Finance Management SaaS Landing Page UI
Helping users take control of their finances with real-time analytics, budgeting tools, and investment insights.Built to inspire trust and drive conversions with clear metrics, modern visuals, and human-centered storytelling.
Challenges: 👇
Designing a fintech SaaS website that makes complex data approachable and easy to digest.
Establishing credibility for a new budgeting & analytics SaaS product in a crowded fintech space.
Solutions: 👇
Developed a clean, minimal SaaS layout emphasizing financial clarity through charts, live analytics, and success stats.
Structured the content flow around user empowerment - from “Take control of your finances” to “Unlock powerful tools to manage your finances.”
1
3
115
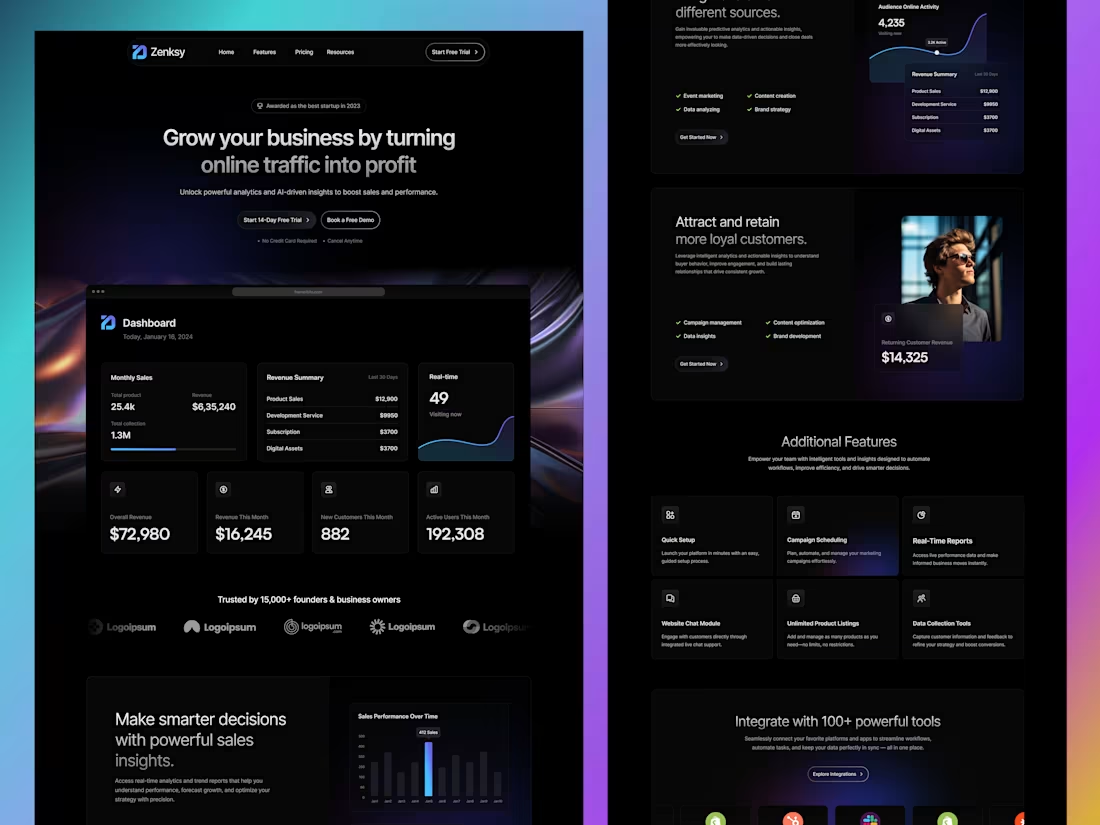
AI-Powered SaaS Analytics Landing Page Design.
AI-driven dashboard redesign - 30% faster insights, 2× smoother workflow, unified dark-mode system.
Challenges: 👇
Presenting complex analytics clearly while maintaining balance and accessibility in a dark UI.
Solutions: 👇
Used modular card layouts, gradient accents, and structured grids to enhance clarity and visual hierarchy — creating a seamless, data-focused experience that empowers better business decisions.
Results & Insights: 👇
During internal testing, task completion time was reduced by 25%, while user satisfaction scores improved from 7.1 to 9.0 out of 10 in post-test surveys. The redesigned system also enabled the team to launch updates twice as fast, thanks to reusable design tokens and a scalable component library.
1
3
81