
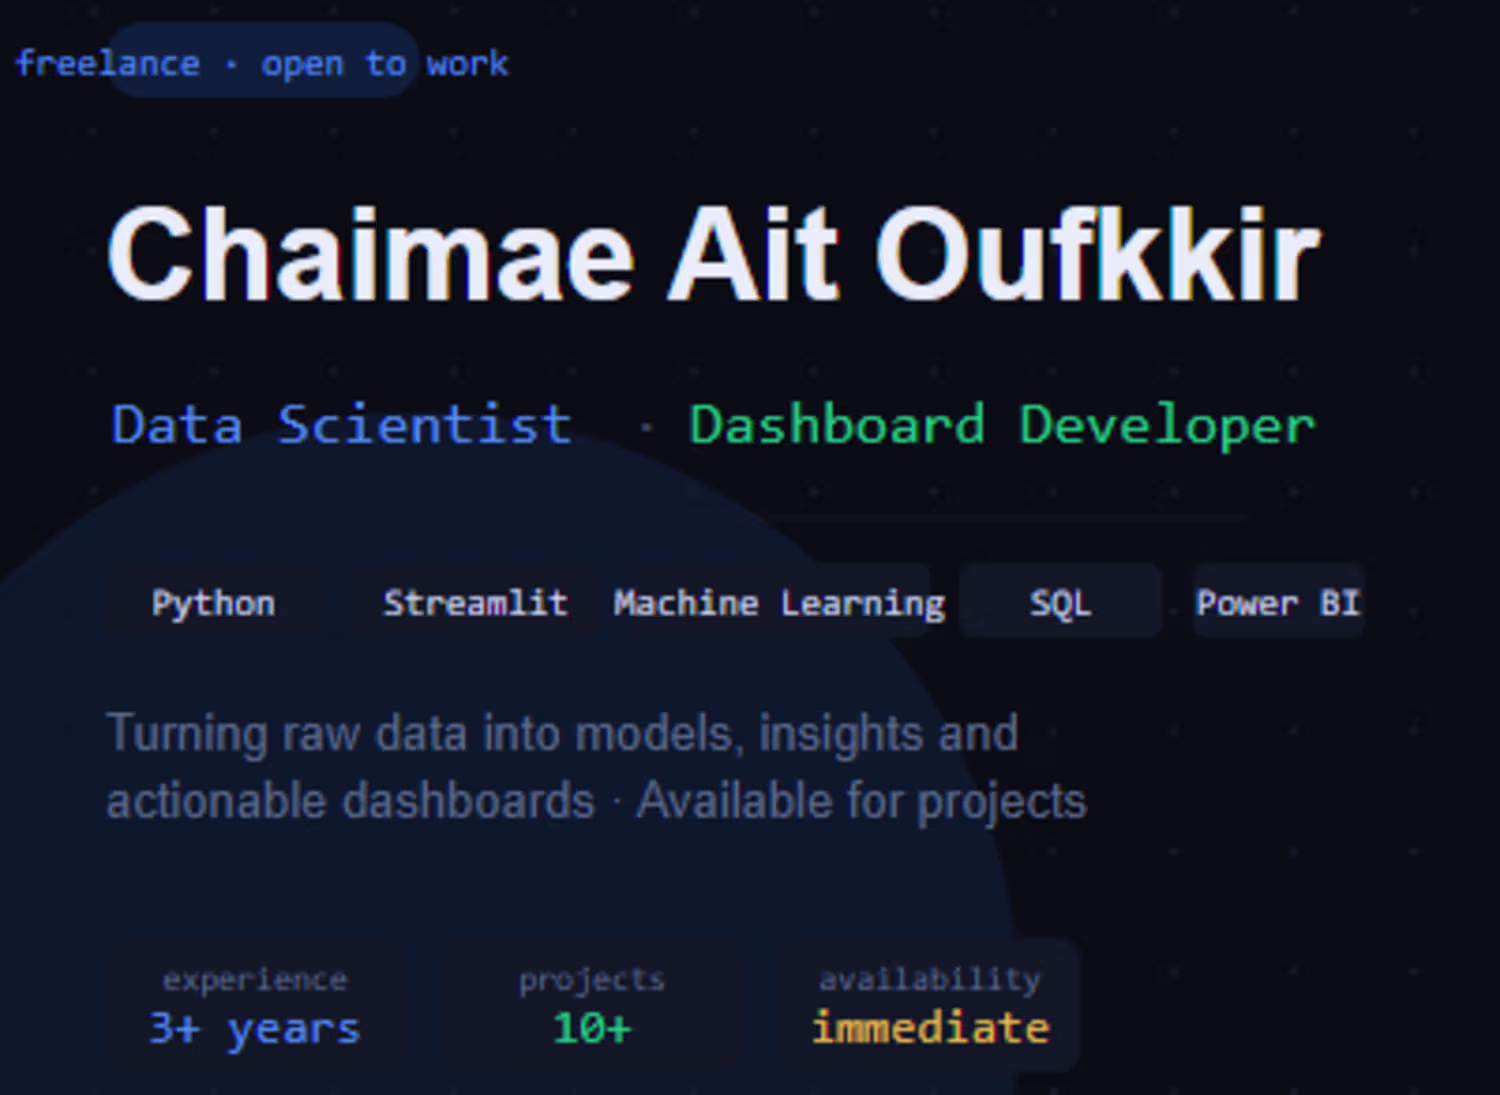
ait oufkkir chaimae
Python Developer | Data, Dashboards & Detection Algorithms
New to Contra
ait oufkkir is building their profile!
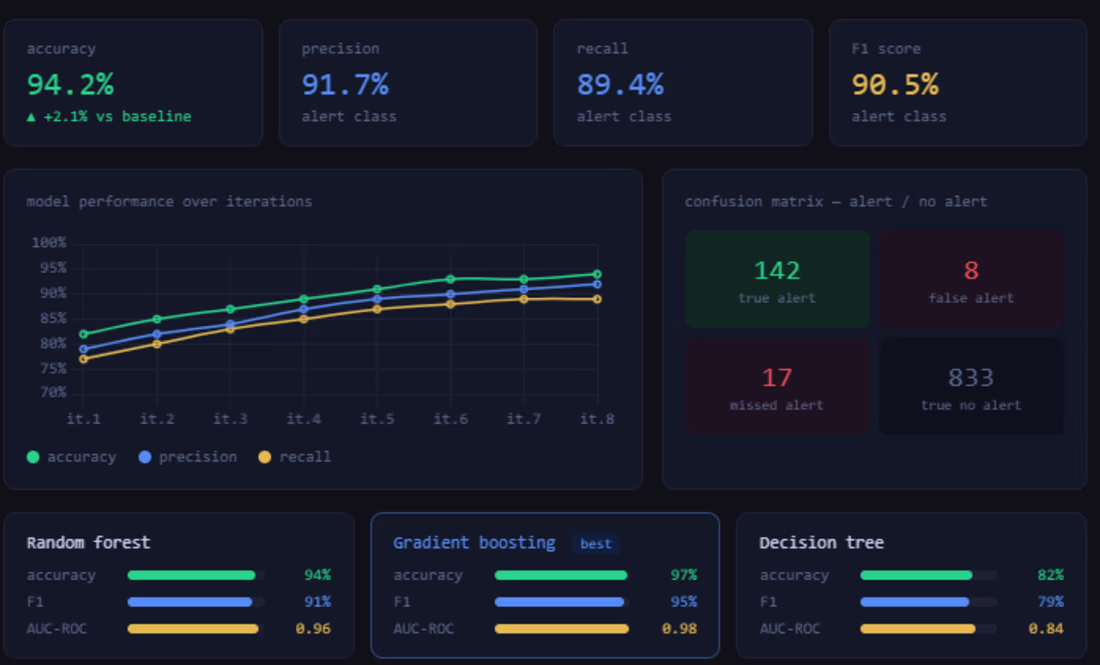
Here's a model evaluation dashboard showing KPI cards (accuracy, precision, recall, F1), a performance-over-iterations chart, a class distribution chart, and a 3-model comparison with bar scores. Gradient boosting is highlighted as the best model.
1
10
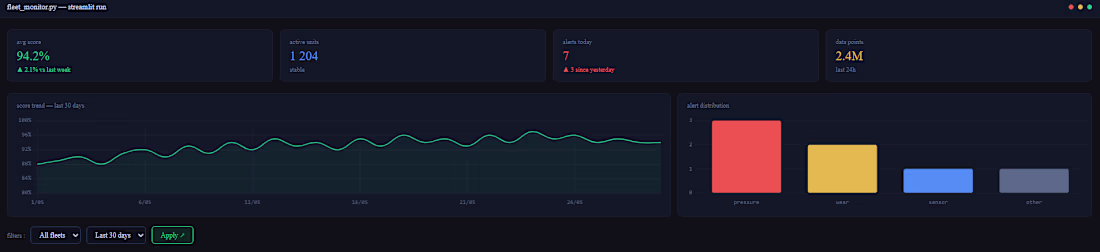
Here's a fully interactive dashboard example.
0
19
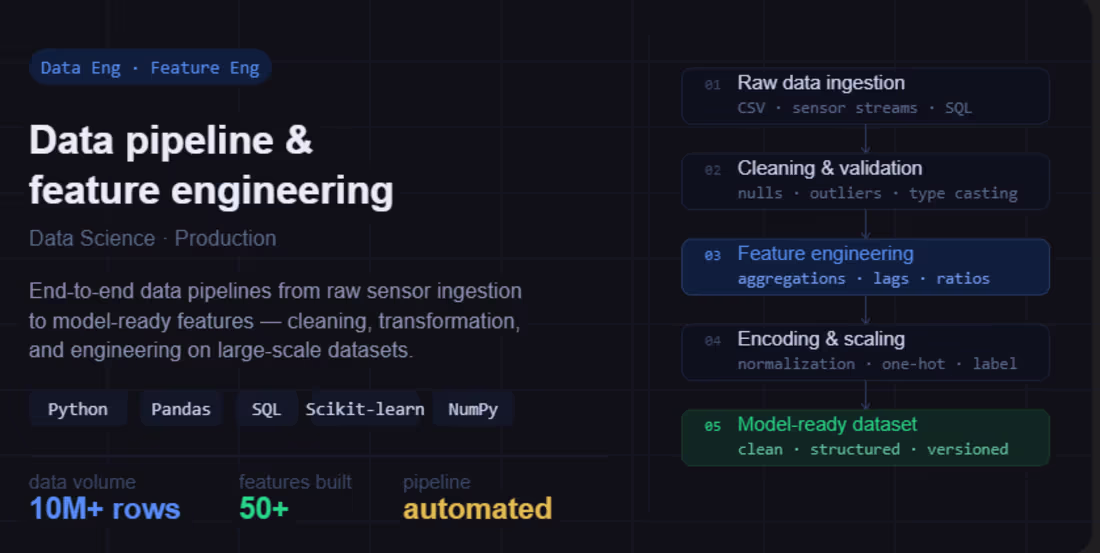
Designed scalable data pipelines and engineered 50+ features from large-scale datasets. Every model is only as good as its data, so I built the foundation first.
1
21
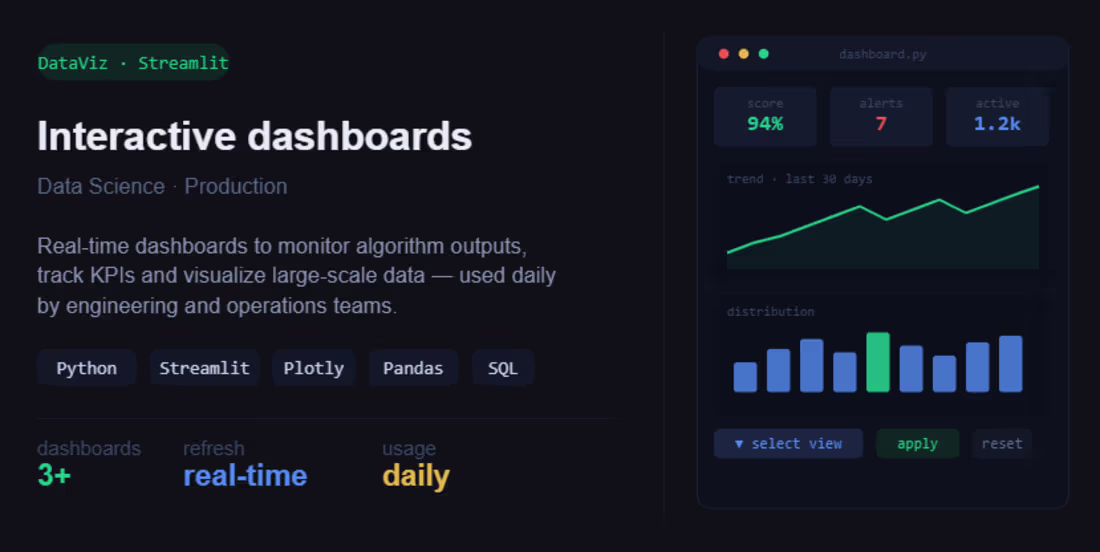
Built real-time interactive dashboards with Streamlit to monitor algorithm outputs and track KPIs on large-scale data, used daily by engineering and operations teams. #DataScience #Streamlit #Python #DataVisualization
1
21