
Aishwarya M. S.
Data Analyst | Excel · SQL · Power BI · Python
New to Contra
Aishwarya is building their profile!
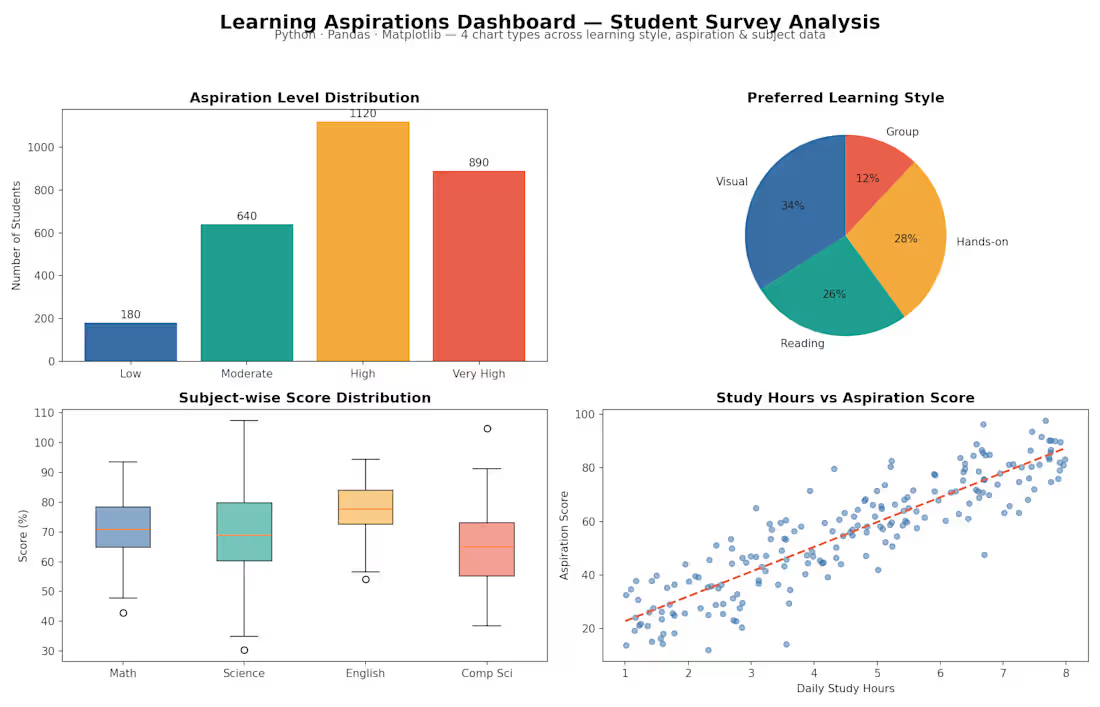
Learning Aspirations Dashboard
Code-based Python dashboard with 4 chart types — bar chart, pie chart, box plot, and scatter plot — visualising student learning aspiration levels, preferred styles, and subject-wise progress.
PythonMatplotlibPandas
4 chart typesCode-based visualisation
0
5
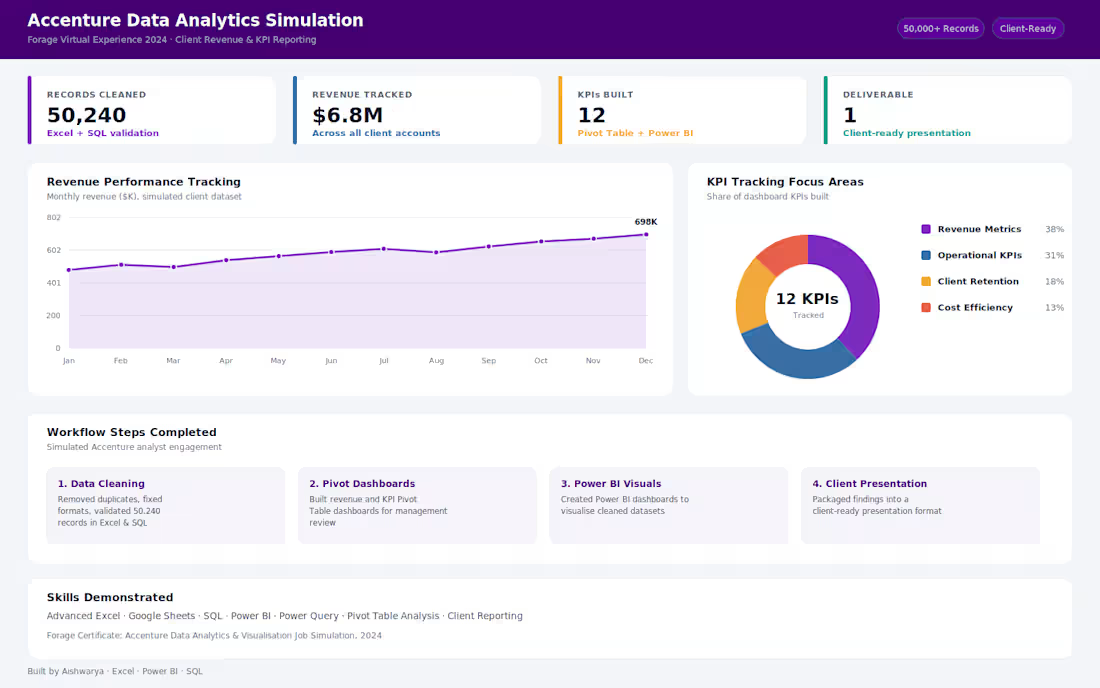
Accenture Data Analytics Simulation
Completed full analyst workflow in a simulated Accenture consulting environment — cleaned 50,000+ records, built Pivot Table dashboards for revenue and KPI tracking, and prepared findings in a client-ready presentation format.
ExcelPower BIPower QuerySQL
0
7
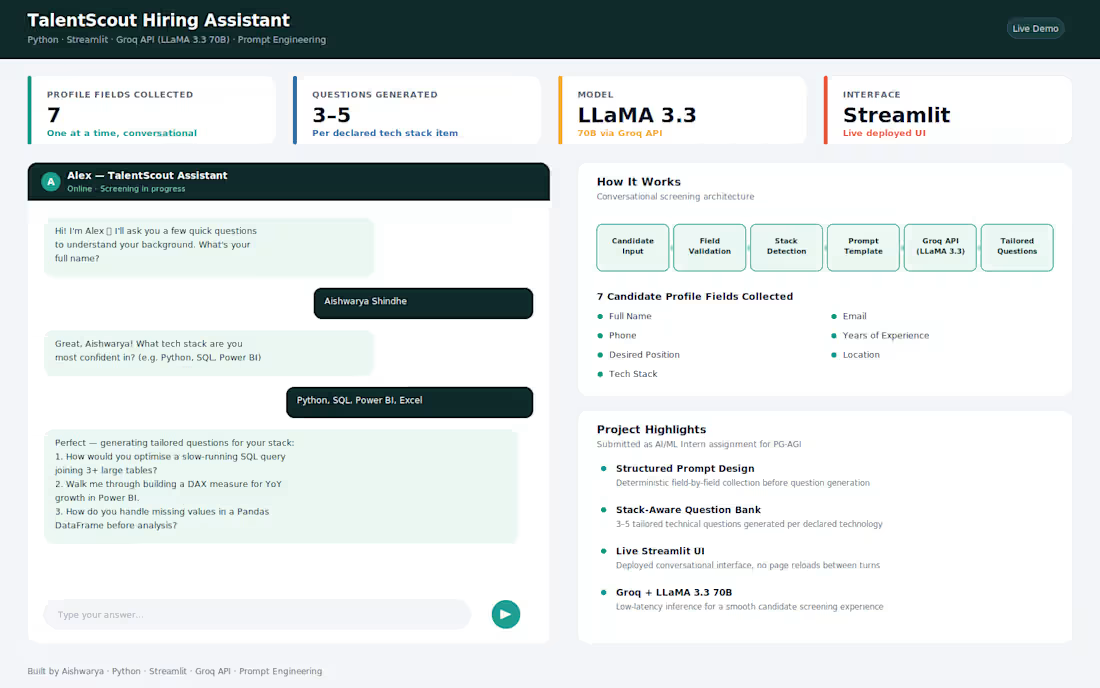
TalentScout Hiring Assistant
Built an AI-powered conversational chatbot that automates candidate screening for tech roles. The bot — named Alex — collects 7 candidate profile fields and generates 3–5 tailored technical interview questions per technology in the candidate's declared stack.
PythonStreamlitGroq APILLaMA 3.3 70BPrompt Engineering
✓ LLM-powered chatbot✓ Live Streamlit UI✓ Structured prompt design
0
20
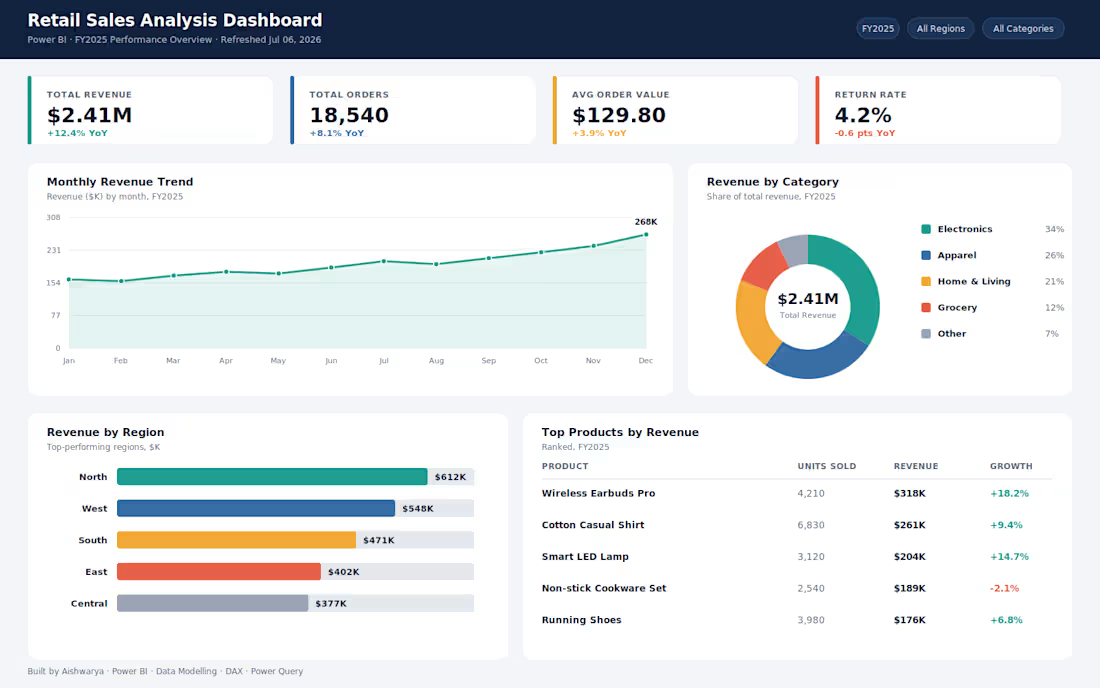
Retail Sales Analysis Dashboard
Cleaned and transformed raw sales data to build an interactive Power BI dashboard tracking revenue, top-performing products, and regional performance with KPI cards and dynamic slicers.
Power BIPower QueryDAXExcel
✓ KPI dashboards✓ Revenue by region✓ Dynamic slicers
0
18