
Aiman Ishaq
Data Analyst skilled in SQL, Python, Excel and Power BI
New to Contra
Aiman is building their profile!


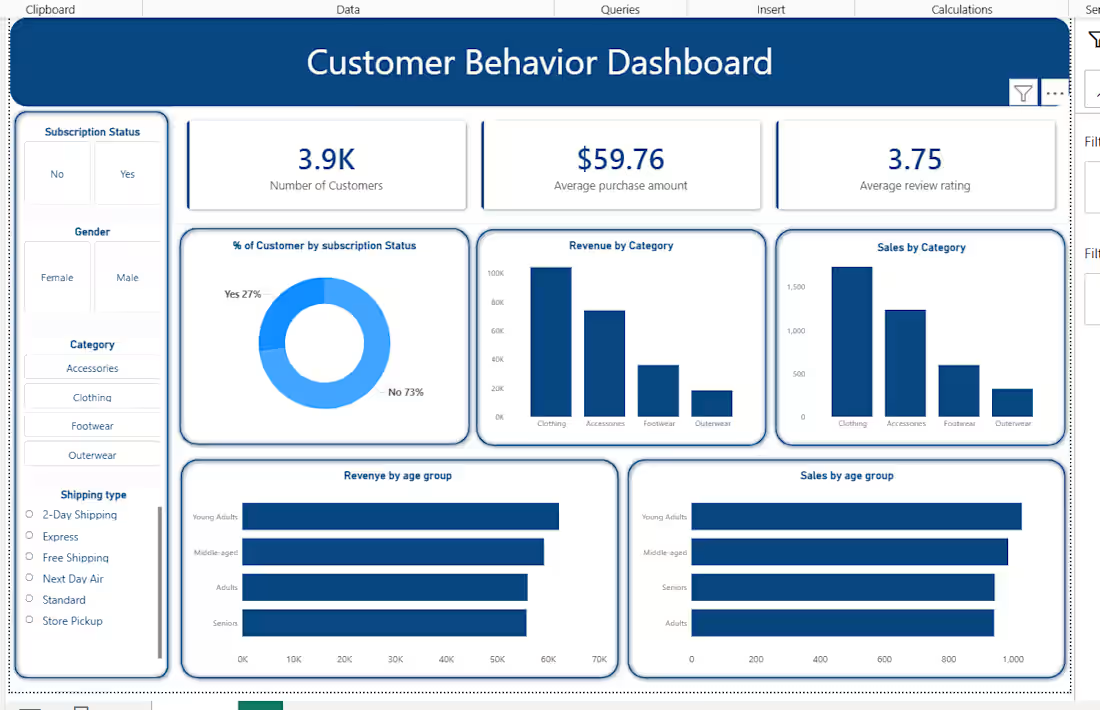
Title: Customer Shopping Behavior Analysis (Python, SQL, Power BI)
Description:
Ran an end-to-end analysis of 3,900 customer shopping records to uncover what actually drives purchases, testing common assumptions about discounts, subscriptions, and age against the actual data rather than taking them at face value.
Cleaned the raw dataset in Python (handled null values, removed a fully redundant column, engineered an age_group segmentation field), loaded it into MySQL, and answered 13 business questions using SQL, including window functions (ROW_NUMBER, RANK with PARTITION BY) to rank products within categories and seasons, and CTEs to segment customers into new, returning, and loyal tiers before cross-analyzing payment behavior.
Key findings ran counter to the obvious assumptions: subscribed customers did not spend more than non-subscribers, discounts had no meaningful effect on review ratings, and Clothing led revenue in every single season without exception. Built an interactive Power BI dashboard with slicers for subscription status, gender, category, and shipping type to make these findings explorable.
0
8
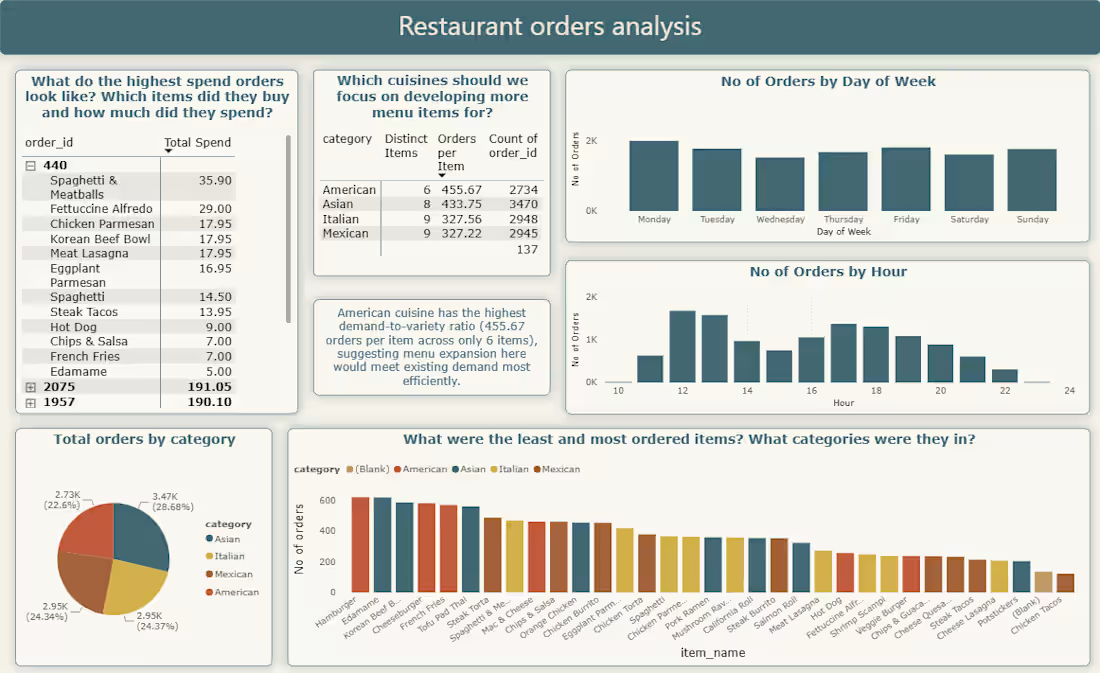
Title: Restaurant Orders Dashboard (Power BI)
Description:
Built an interactive Power BI dashboard analyzing 12,000+ restaurant order line items to answer four operational questions: which menu items sell best and worst, what the highest-value orders look like, when order volume peaks throughout the day, and which cuisine category has the strongest case for menu expansion based on demand relative to current item variety.
Modeled relationships between order-level and menu-level tables, built calculated columns for time-based analysis (hour, day of week), and used DAX measures to compare order volume against menu size per cuisine category, surfacing that American cuisine has the highest orders-per-item ratio across the menu, a clear signal for where to expand.
While validating the results against raw data, caught and fixed a modeling bug where duplicate items within a single order were being undercounted in a grouped visual, corrected by restructuring the aggregation as an explicit measure rather than an implicit cross-table sum.
Full breakdown and dashboard file available on GitHub: https://github.com/aiman-ami/restaurant-orders-dashboard
Skills: Power BI, DAX, Data Modeling, Data Visualization, Python (validation)
0
14
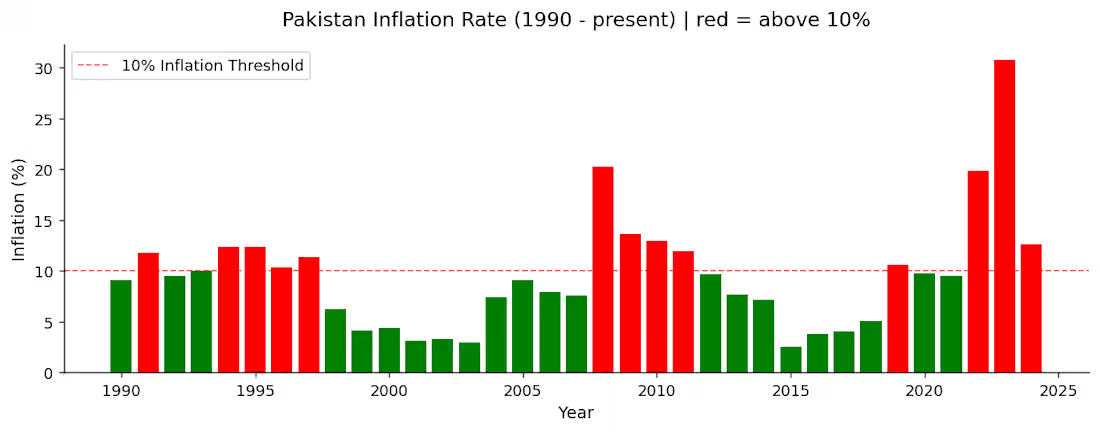
Cleaning and analysis of World Bank economic indicators (GDP, inflation, unemployment) for 217 economies (countries and territories) using Python and pandas, with a focus on Pakistan's position against South Asian peers from 1990 to present.
1
21
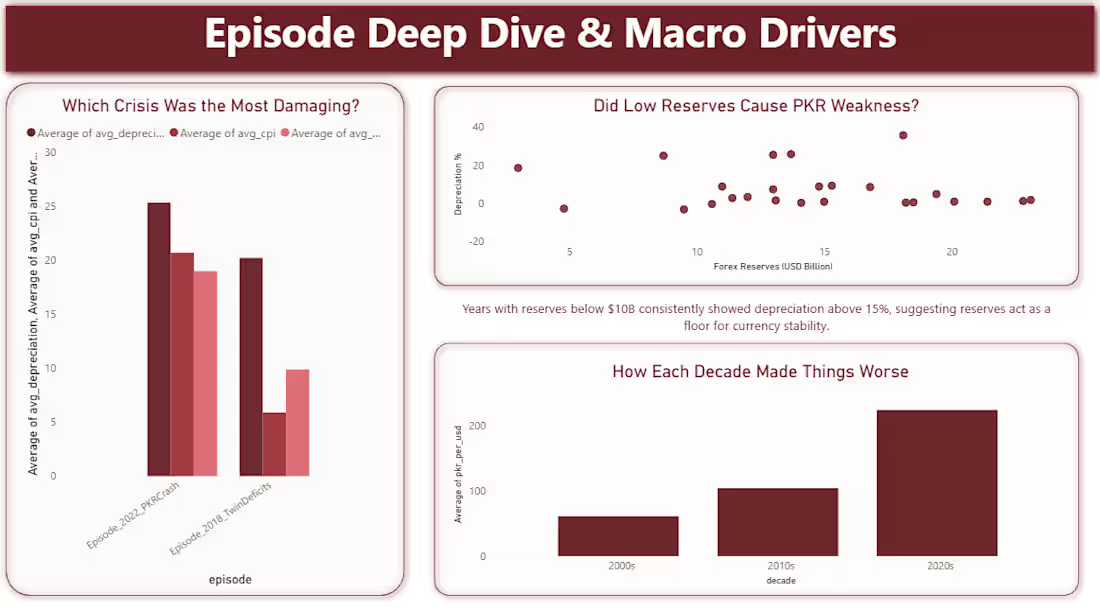
I analyzed 25 years of Pakistani Rupee depreciation and found something most people miss: the 2022 crash wasn't just "bad luck." It was structurally worse than 2018, 57% total depreciation vs 42%, with inflation peaking at 29.2% in 2023. Built with Python, MySQL, and Power BI. I filtered pass-through coefficients >2%, mapped twin deficit episodes, and traced how supply shocks and IMF entry timing shaped the rupee's 80% value loss. Data storytelling for economic reality.
0
26