
ahmed khalil
Banking Expert & Power BI Data Analyst
New to Contra
ahmed is building their profile!
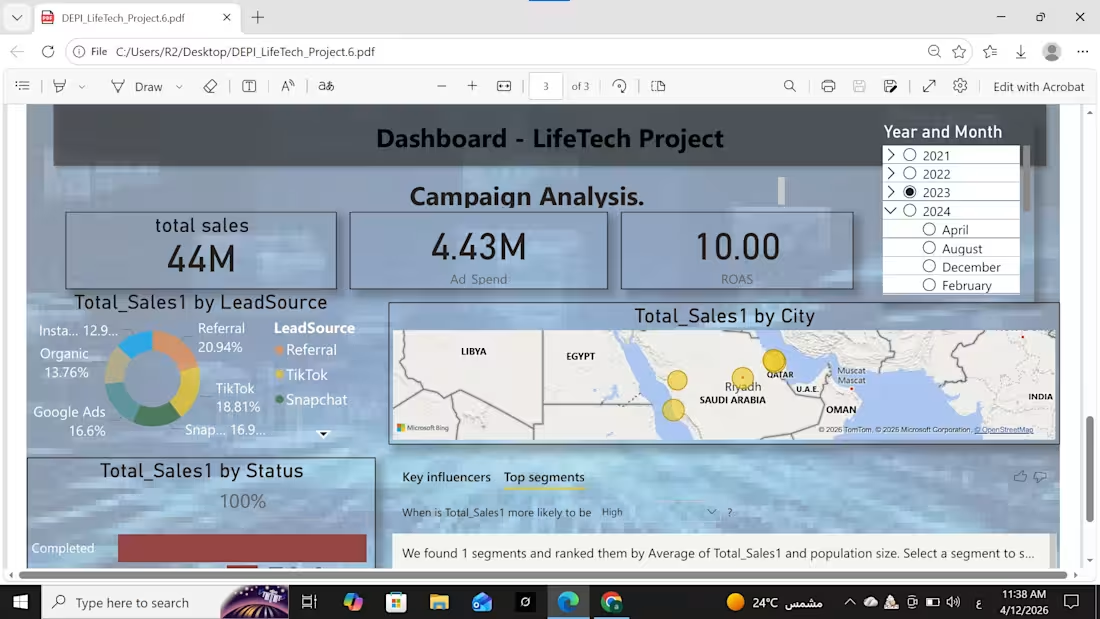
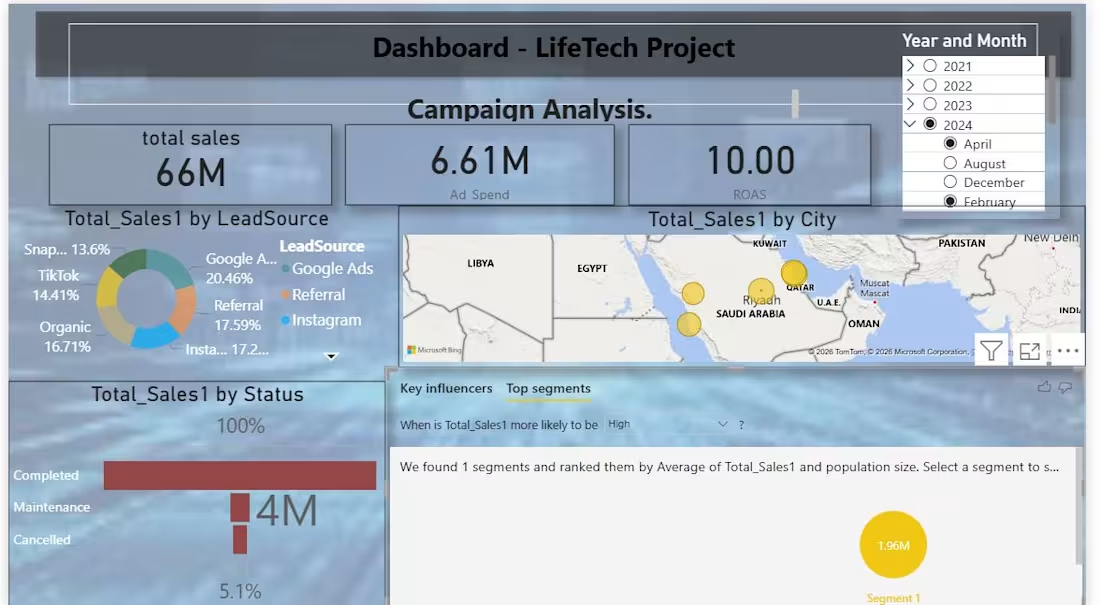
"Comprehensive Campaign Analysis Dashboard - LifeTech. This project analyzes $44M in total sales with a 10.00 ROAS, focusing on lead source performance across Google Ads, TikTok, and Instagram. It includes detailed geographical mapping of sales and status tracking for completed versus cancelled orders to optimize marketing efficiency."
0
5
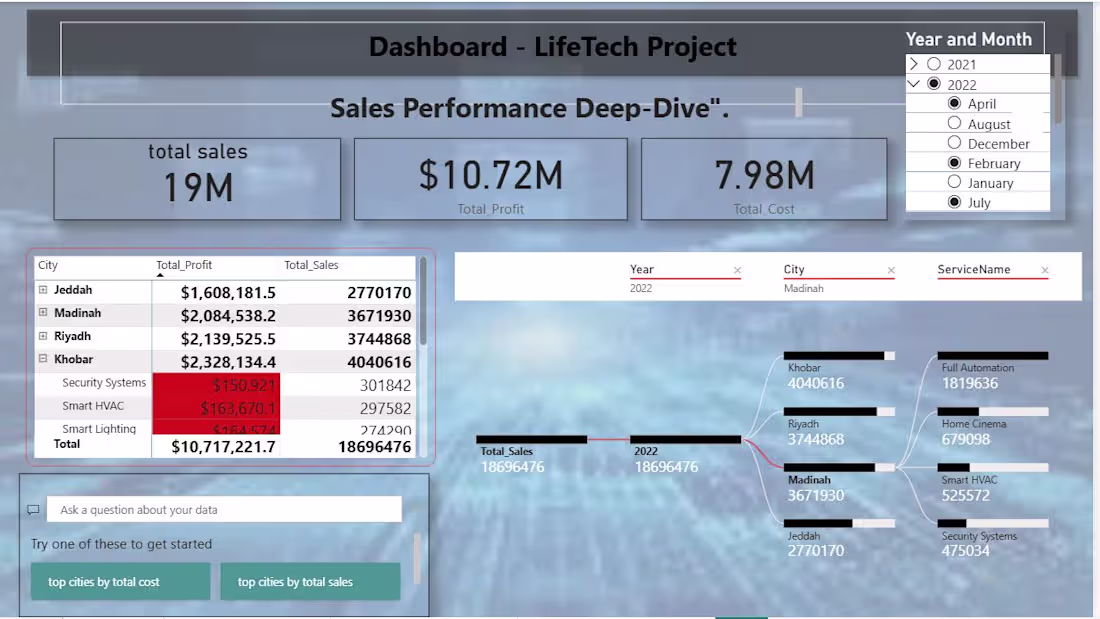
"Sales Performance Deep-Dive Dashboard. This Power BI report analyzes $19M in total sales with a detailed breakdown of profits across different cities like Jeddah, Madinah, and Riyadh. It tracks service performance for Smart HVAC and Security Systems, providing clear insights into revenue growth and cost management."
0
9
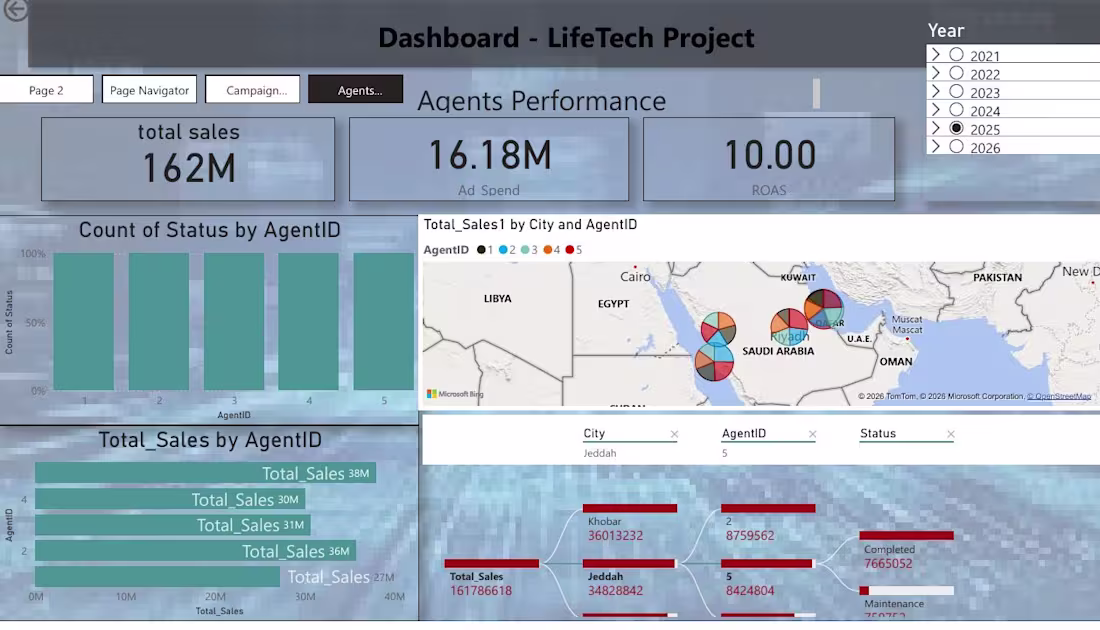
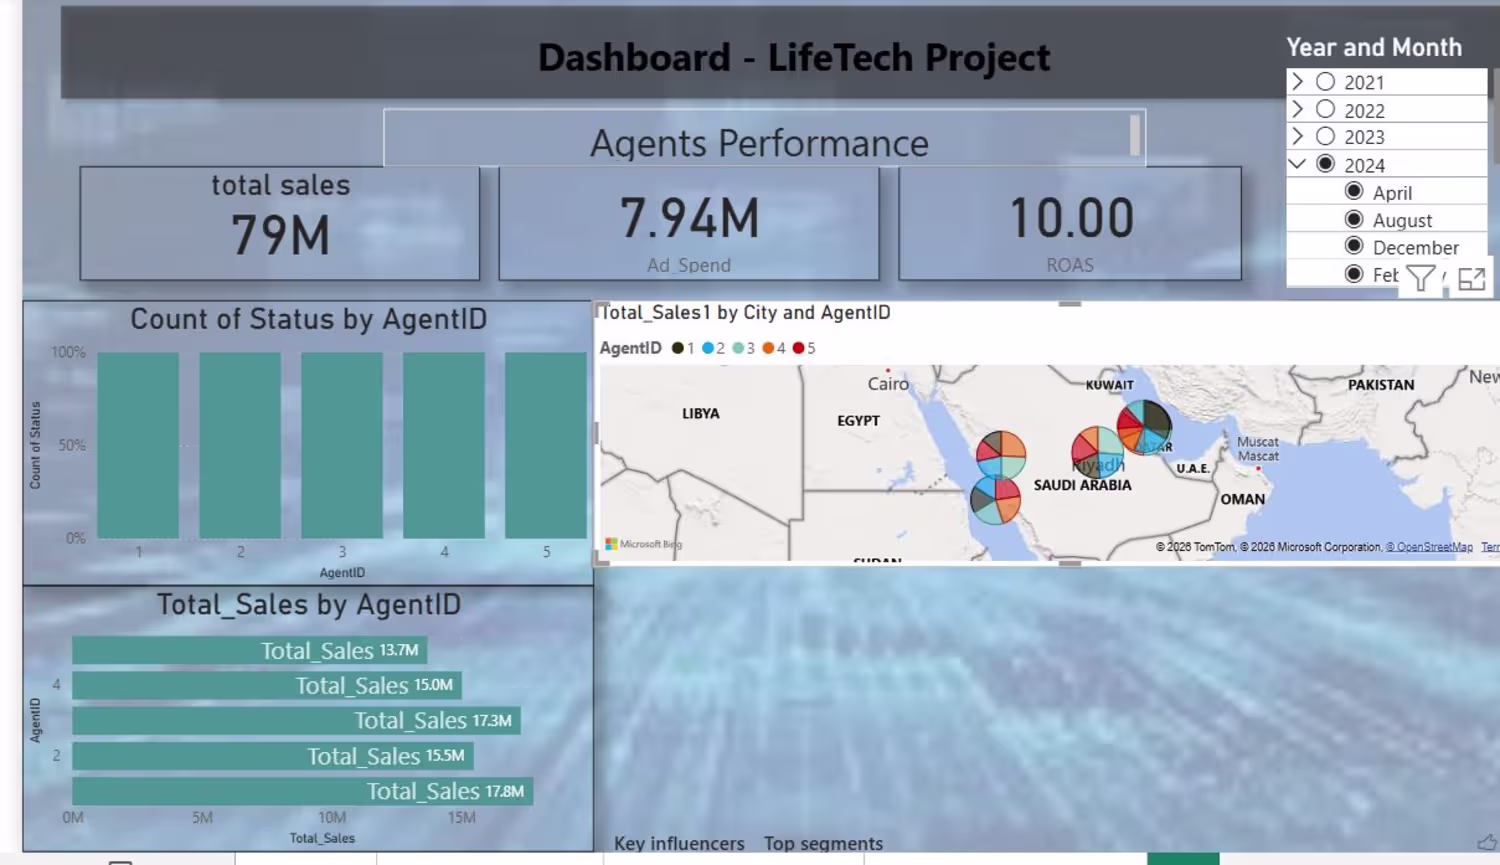
"Financial Sales Analysis Dashboard - LifeTech. This report highlights key performance indicators including $162M in total sales and a 10.00 ROAS. It provides deep insights into agent performance and regional sales distribution across the Middle East, built with Power BI to drive data-informed business strategies."
0
12
"Financial Dashboard & Campaign Analysis using Power BI. This project demonstrates my ability to analyze multi-million dollar sales data, track advertising spend (Ad Spend), and monitor campaign performance across different regions including Egypt and Saudi Arabia. It includes advanced data visualization for total sales, ROAS, and lead source tracking."
0
24