
Ahmed Elsayed
“Junior Data Analyst | Excel & Power BI
New to Contra
Ahmed is building their profile!

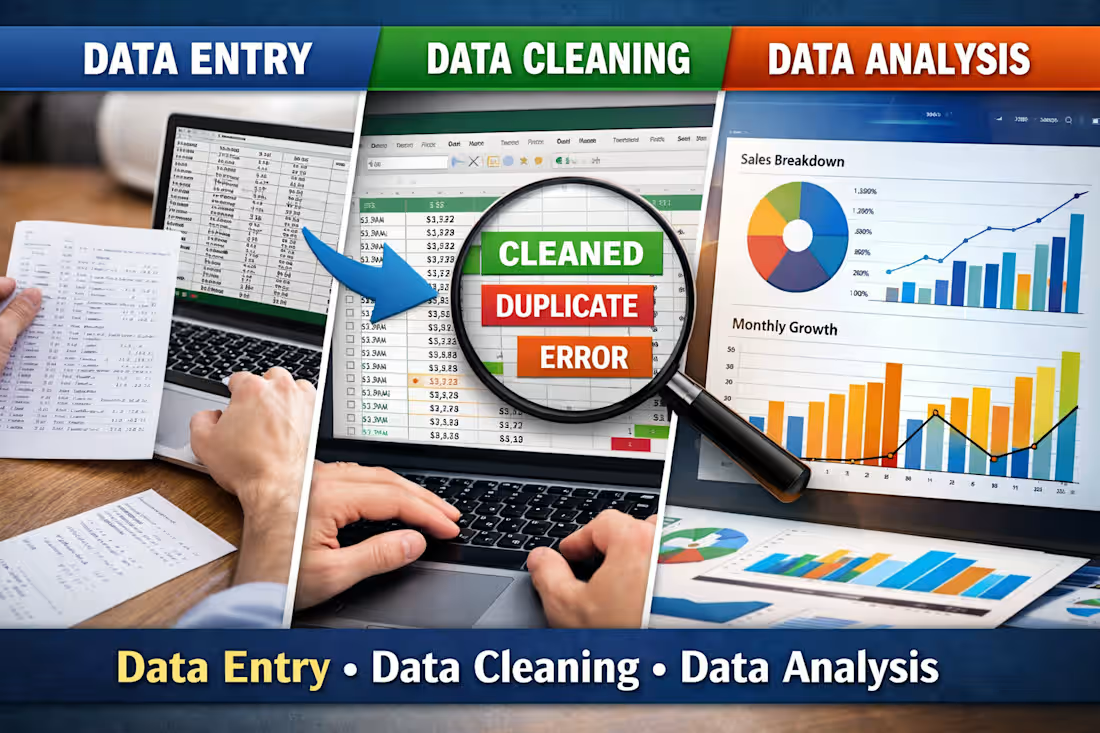
The Three Stages:
Data Entry: Moving manual records to digital systems.
Data Cleaning: Eliminating errors and duplicates for 100% accuracy.
Data Analysis: Turning clean data into visual, actionable dashboards.
The Message: "I don't just collect data—I refine it and make it useful for your business."
0
6
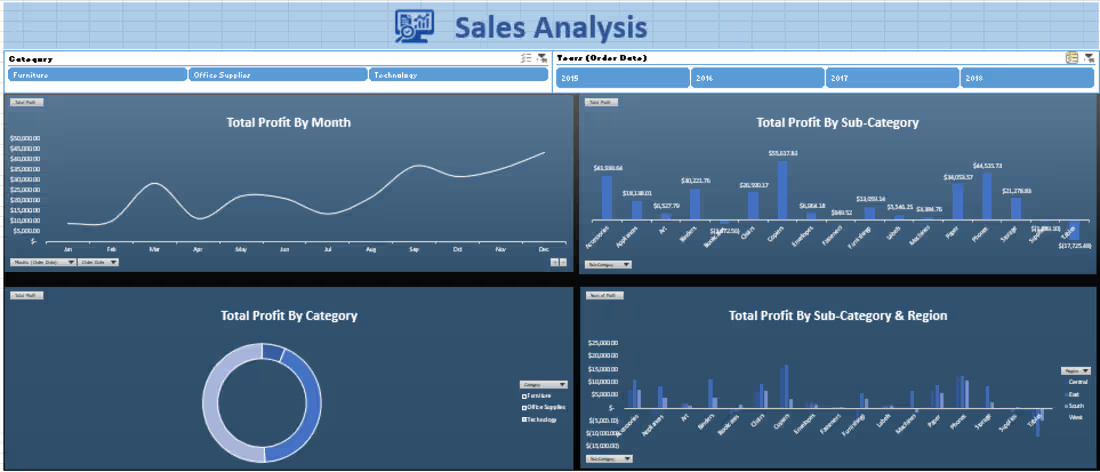
Profitability & Margin Analytics
Headline: Advanced Profitability Distribution & Regional Contribution.
Description: A specialized analytical view focused on bottom-line health. This dashboard tracks Profit by Sub-Category and Region to pinpoint high-margin products versus loss leaders.
Key Insight: Visualizes the discrepancy between high-volume sales and actual profit, specifically identifying categories like "Tables" that may require pricing strategy adjustments due to negative margins in certain regions.
1
15
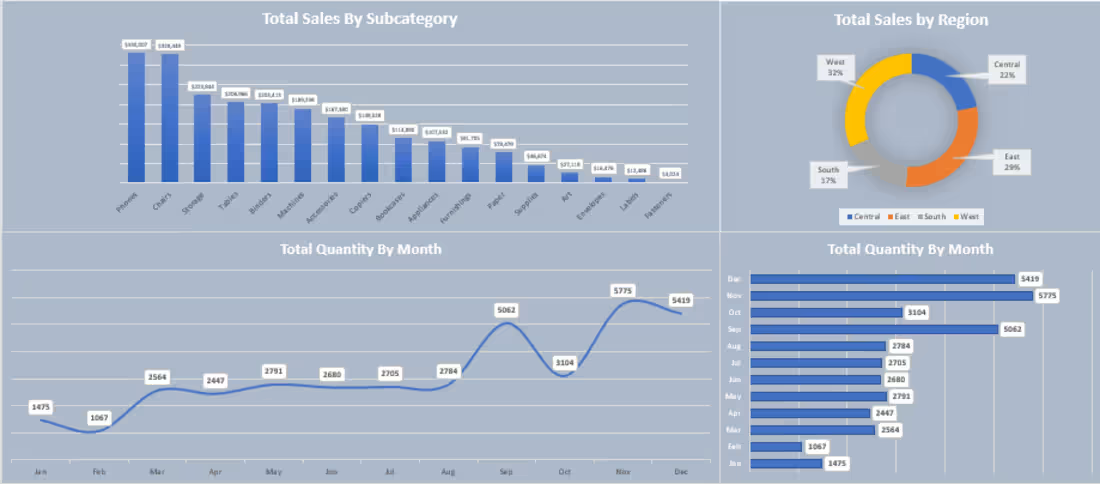
Regional Sales & Monthly Volume Analysis
Headline: Subcategory Deep-Dive & Seasonal Demand Tracking.
Description: An operational dashboard focusing on product performance and logistics. It features a detailed breakdown of Sales by Subcategory (identifying Phones and Chairs as top drivers) and a Total Quantity by Month trend line.
Key Insight: Highlights significant seasonal spikes in Q4 (November/December), providing actionable data for inventory planning and regional resource allocation
1
26
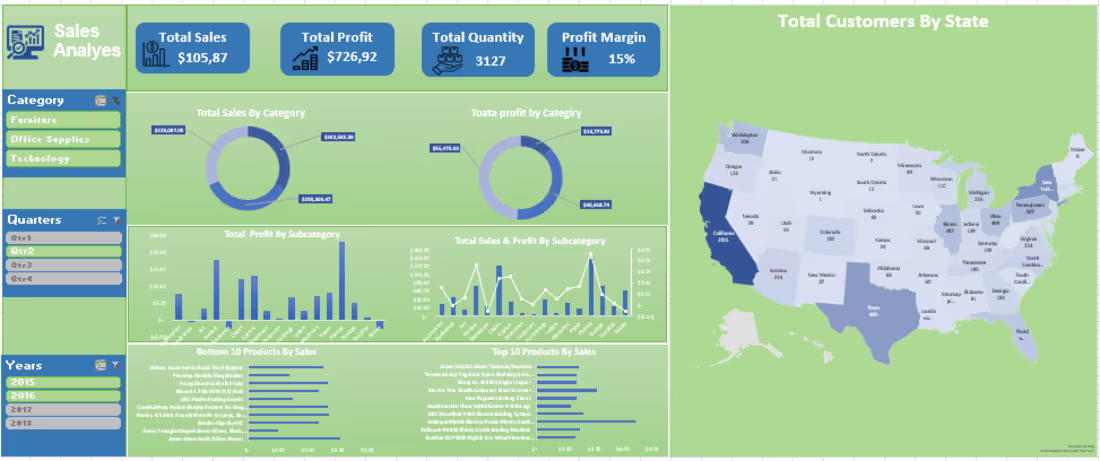
Executive Sales Overview
Headline: Multi-Year Sales Performance & Demographic Dashboard.
Description: A high-level executive dashboard designed to monitor core business KPIs including Total Sales ($105k+), Profit Margin (15%), and Customer Density across the United States.
Key Insight: This view allows stakeholders to filter performance by Year (2015–2018) and Category to identify growth trends and regional market leaders like California
1
37