
Aditya Pawar
I am Data Analyst with experience in Power BI, Excel & SQL.
New to Contra
Aditya is building their profile!
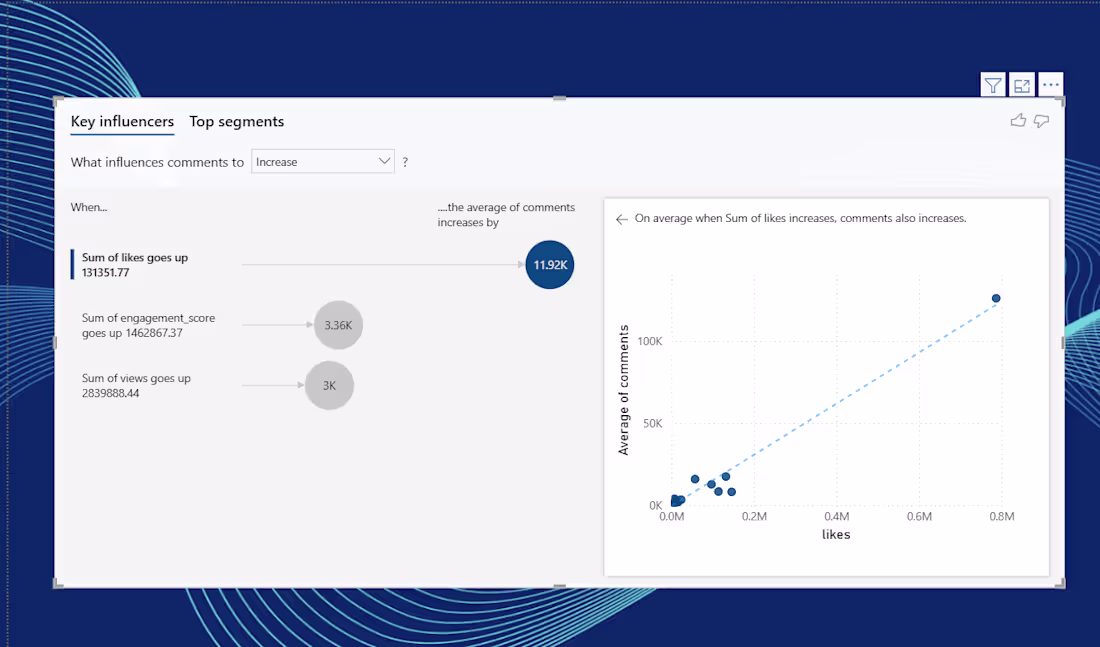
🚀 Power BI Project Completed | Real-Time Viewer Engagement Analytics Dashboard
I recently built an interactive Power BI dashboard to analyze viewer engagement performance using real-world video data.
📊 What I tracked & analyzed:
✅ Views, Likes, Comments
✅ Like Rate & Comment Rate
✅ Engagement Score
✅ Retention Rate & Drop-off Rate
✅ Key Influencers affecting engagement
🔍 Key Insight:
Engagement isn’t driven by views alone — retention and interaction rate play a major role in predicting strong-performing content.
2
17
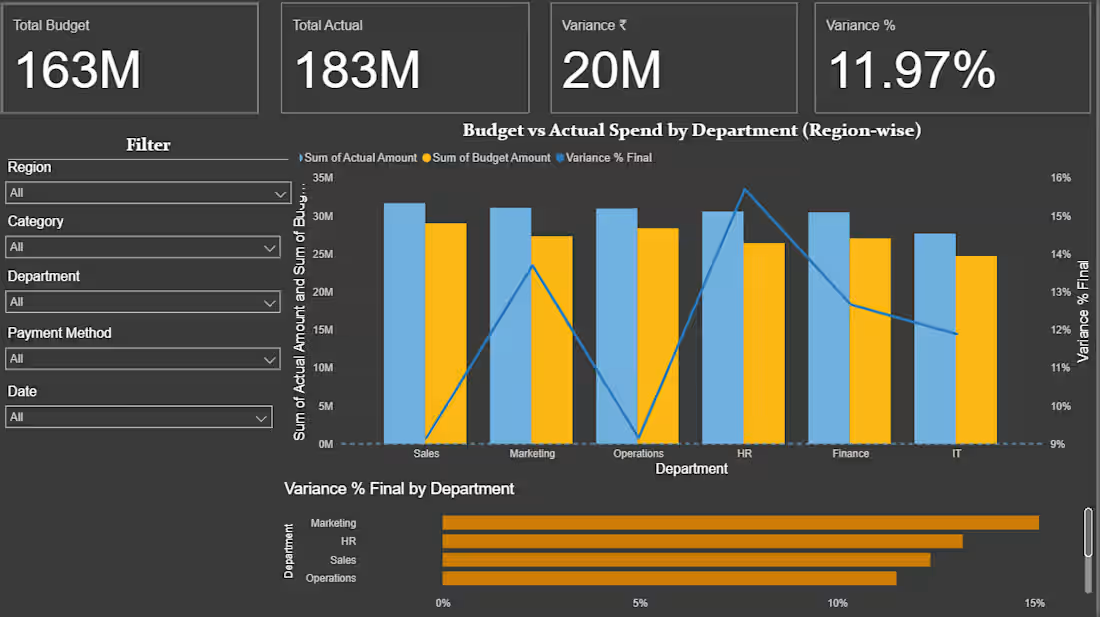
Most finance teams know their total spend. Very few know exactly where the overspending is happening — until it is too late.
I recently built a Finance Dashboard in Power BI that tracks Budget vs Actual Spend across departments and regions, designed to give leadership real-time visibility into financial performance.
What the dashboard delivers:
· Interactive KPIs with variance analysis to flag overspending at a glance
· Slicers by department, region, and time period for flexible, self-serve exploration
· Clear visual separation between on-track spend and budget overruns
The goal was simple: reduce the time between "something is off" and "we know what to fix."
When finance data is structured well and presented clearly, decision-makers do not need to wait for the end-of-quarter report to course-correct — they can act in the moment.
If your business needs better visibility into its financial data, I can help you build a dashboard tailored to your reporting needs.
#PowerBI #FinanceAnalytics #BudgetVsActual #DataVisualization #BusinessIntelligence #FinanceDashboard
0
9
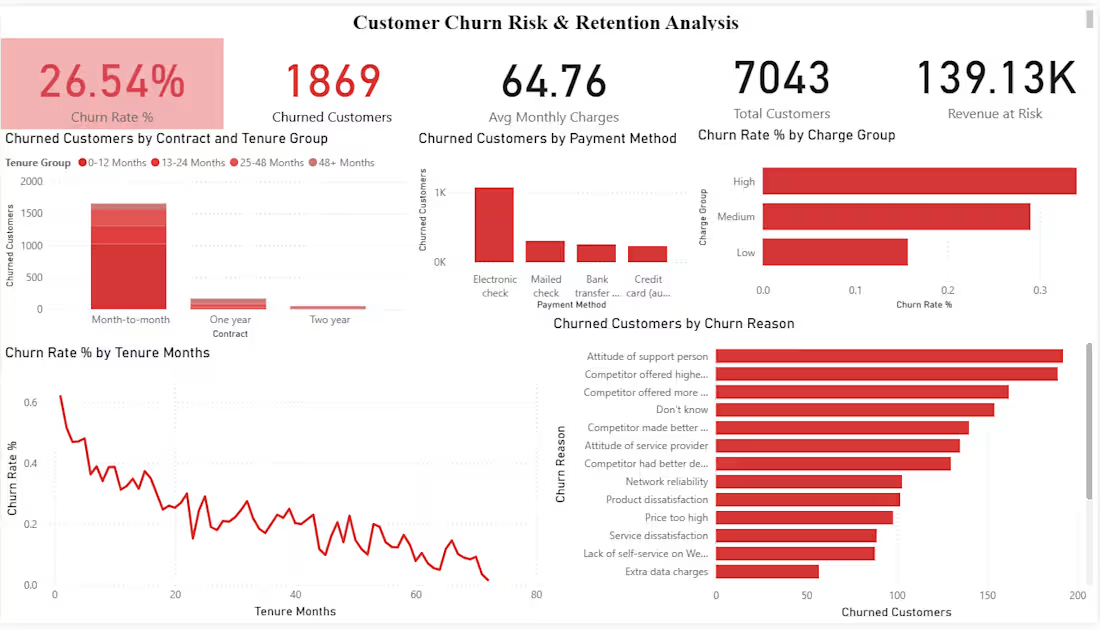
Customer Churn Risk & Retention Analysis | Power BI
Built an end-to-end churn dashboard analyzing 7,043 telecom customers.
🔎 Key Insights:
• 26.5% overall churn rate
• Month-to-month contracts show highest churn
• First 12 months are the highest risk period
• High monthly charges increase churn probability
• ₹139K+ revenue at risk.
0
14
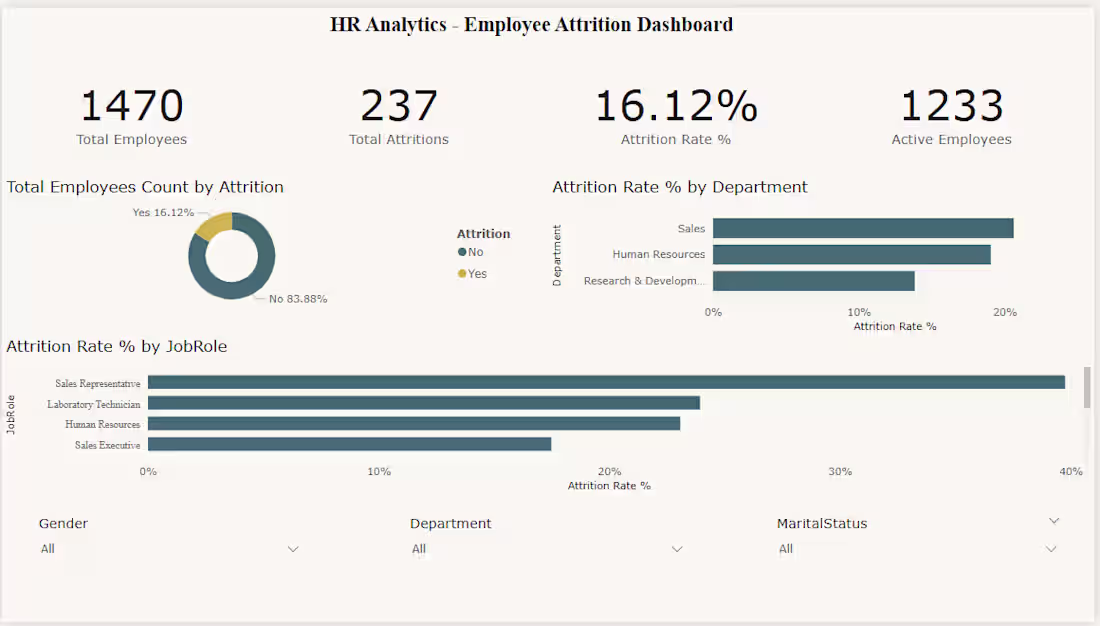
I spent time actually understanding the data before touching Power BI.
And what I found was honestly surprising.
Out of 1,470 employees —
→ 237 left the company (16.1% attrition rate)
→ Employees working overtime were 3x more likely to leave
→ 1 in 3 new joiners left within their first year
→ Employees earning below $3K/month had the highest exit rate
These aren't just numbers on a screen.
These are real patterns that HR teams can act on — before someone puts in their papers.
0
18