
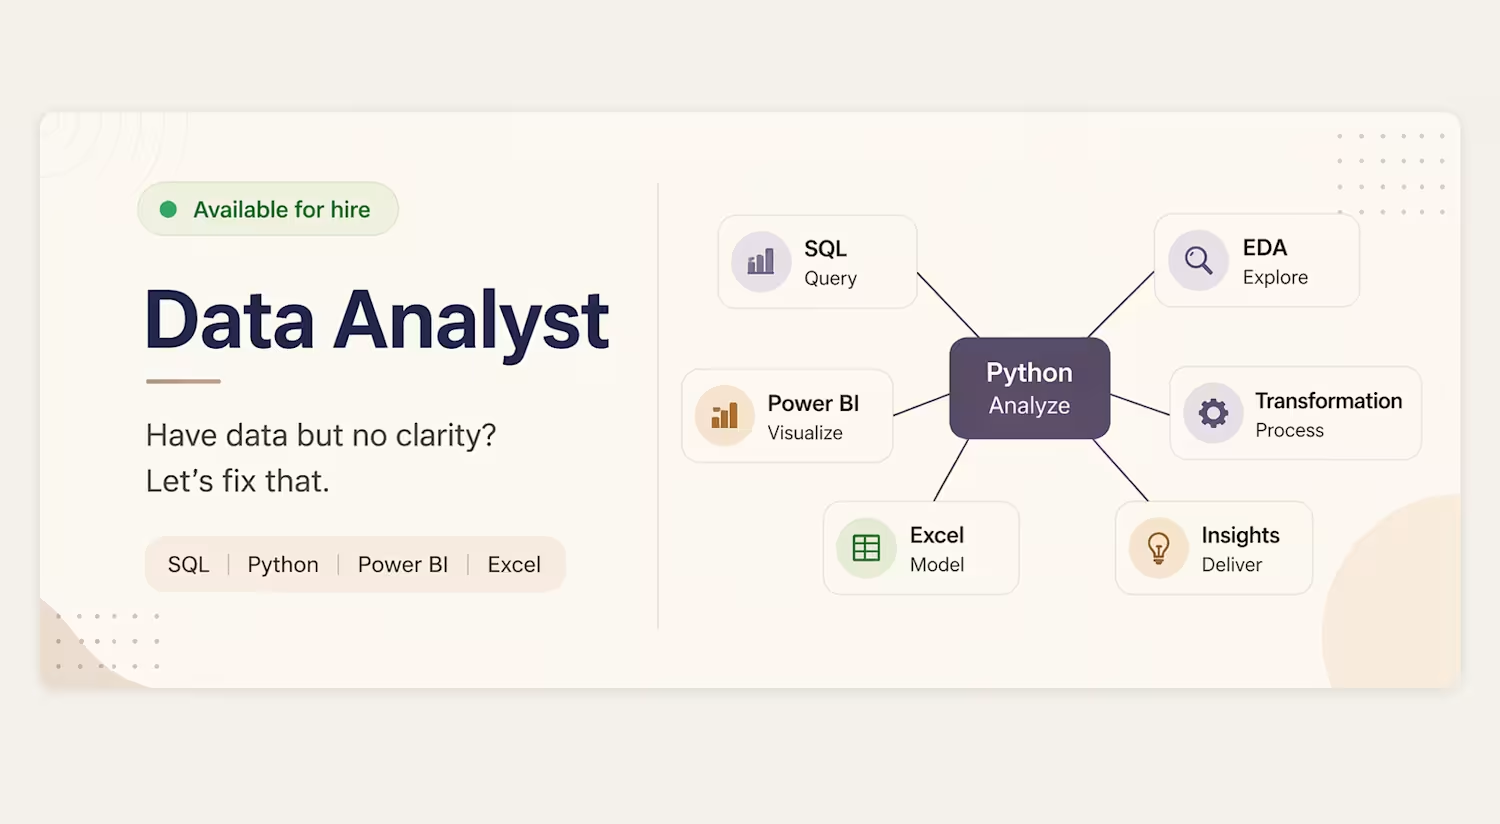
Aditi Singh
Your data has a story. Insights are my job
New to Contra
Aditi is building their profile!
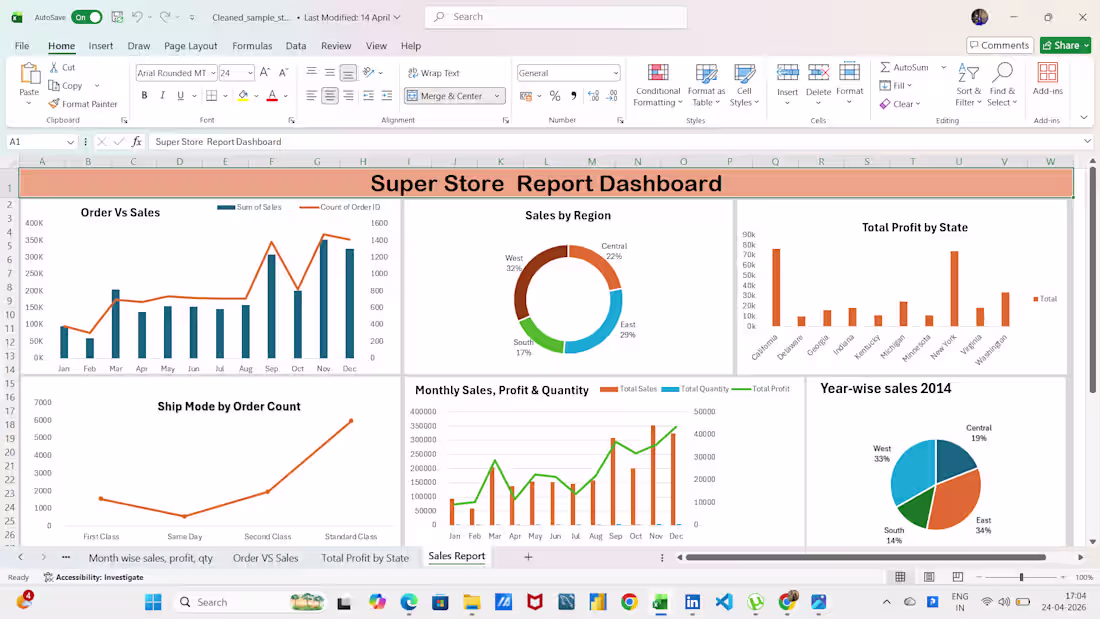
Excel Dashboard on Superstore Dataset
Key Insights from the Dashboard:
Order vs Sales Trend
Profit Analysis (State-wise)
Sales by Region
Shipping Mode Insights
Monthly Performance (Sales, Profit & Quantity)
Year-wise Regional Contribution
0
22
Brazilian E-Commerce (Olist) — End-to-End Analysis
I worked on the Olist Brazilian E-Commerce dataset a real-world dataset with 9 separate CSV files and hundreds of thousands of rows of data across all of them.
Before any analysis could happen, all nine files had to be understood individually, audited for quality, and then carefully merged into a single master dataframe which I named olist_df.
That merge is not a one liner. It requires knowing which files connect to which, through which keys, and in which order. The full preprocessing and merging pipeline is documented step by step in this notebook.
KPI Found
1. Average review score by product category
2. Payment type and Review score distribution
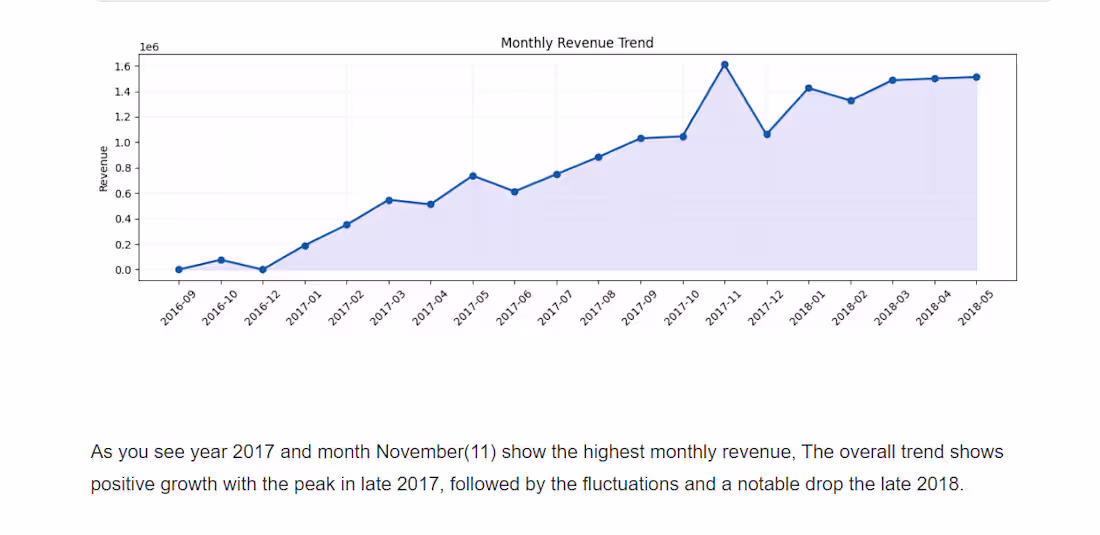
3. Monthly Revenue Trend Analysis
4. On-Time Delivery Rate
5. Monthly On-Time Delivery
6. Order Cancellation Rate
7. Monthly cancellation trend
0
26

End to end analysis of the Global Superstore dataset, focusing on understanding sales performance, customer behavior, and shipping efficiency across multiple regions and markets.
The analysis follows a structured data analytics workflow:
1. Data Cleaning & Preparation
2. Exploratory Data Analysis (EDA)
3.Data Visualization
All analyses were performed using Python (Pandas,NumPY, Matplotlib, and Seaborn) with a focus on generating business-driven insights and supporting data-informed decision-making.
1
36