
Abdelhaq El Mandouli
Data Analyst | Python, SQL, Excel, Power BI & Tableau
New to Contra
Abdelhaq is building their profile!

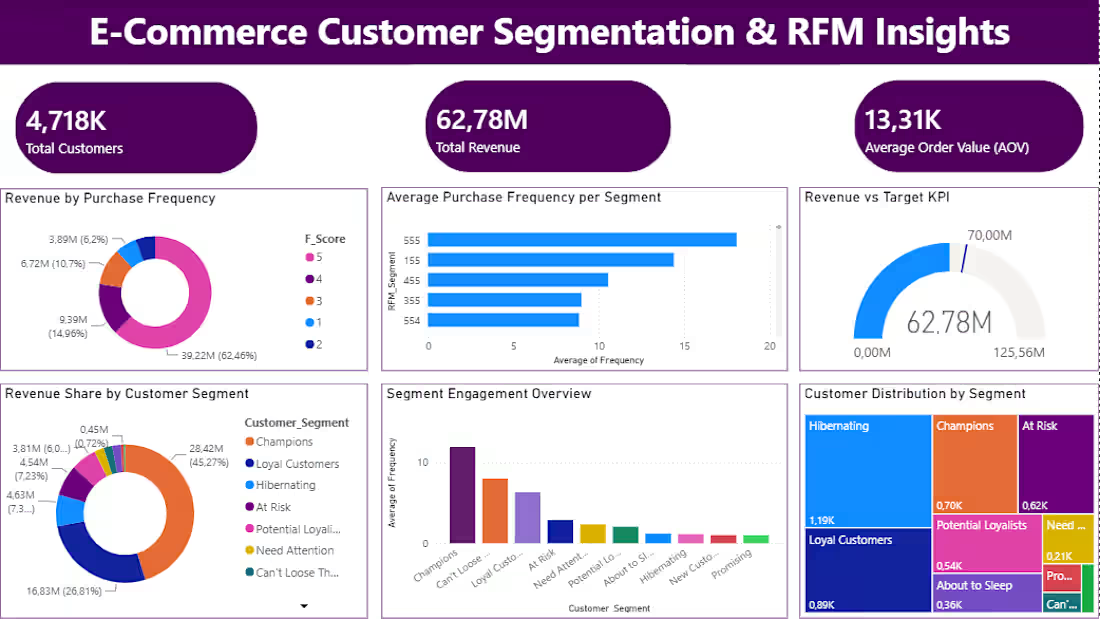
How do you double your e-commerce sales without increasing your ad spend? 🤔💰
Many store owners spend thousands of dollars acquiring new customers, completely ignoring the hidden goldmine: their existing customer data.
As a Data Analyst, I built an end-to-end Customer Segmentation & RFM Insights project to analyze actual purchasing behavior and uncover growth strategies that maximize Customer Lifetime Value (CLV).
📊 Key Data Insights from the Dashboard:
* The Loyalty Backbone: "Champions" and "Loyal Customers" generate over 72% of total revenue ($45.25M combined). Retaining them is the store's highest ROI strategy.
* Frequency is King: Customers with a Frequency Score of 5 single-handedly drive 62.48% ($39.22M) of top-line growth.
* The Leaking Bucket: While Champions bring in the cash, the "Hibernating" segment holds the largest volume of users. This highlights a massive opportunity for targeted win-back email campaigns.
* Basket Health: The Average Order Value (AOV) stands strong at $13.31K, serving as our baseline KPI benchmark.
🛠️ The Tech Stack:
* Data Pipeline: Python (Pandas, NumPy)
* Business Intelligence: Power BI
🔗 GitHub Repository: [https://github.com/AbdelhaqTheAnalyst/E-Commerce-Customer-Segmentation-RFM-Insights ]
📬 To E-commerce Founders & Marketing Agencies: If you want to turn your raw transactional data into actionable strategies that boost profits and cut customer acquisition costs (CAC), let’s connect! Drop me a DM, and let’s discuss how I can help your business grow.
hashtag#DataAnalytics (https://www.linkedin.com/search/results/all/?keywords=%23dataanalytics&origin=HASH_TAG_FROM_FEED) hashtag#PowerBI (https://www.linkedin.com/search/results/all/?keywords=%23powerbi&origin=HASH_TAG_FROM_FEED) hashtag#Ecommerce (https://www.linkedin.com/search/results/all/?keywords=%23ecommerce&origin=HASH_TAG_FROM_FEED) hashtag#RFMAnalysis (https://www.linkedin.com/search/results/all/?keywords=%23rfmanalysis&origin=HASH_TAG_FROM_FEED) hashtag#GrowthHacking (https://www.linkedin.com/search/results/all/?keywords=%23growthhacking&origin=HASH_TAG_FROM_FEED) hashtag#DataDriven (https://www.linkedin.com/search/results/all/?keywords=%23datadriven&origin=HASH_TAG_FROM_FEED) hashtag#DataAnalyst (https://www.linkedin.com/search/results/all/?keywords=%23dataanalyst&origin=HASH_TAG_FROM_FEED) hashtag#JobSearch (https://www.linkedin.com/search/results/all/?keywords=%23jobsearch&origin=HASH_TAG_FROM_FEED)
0
6
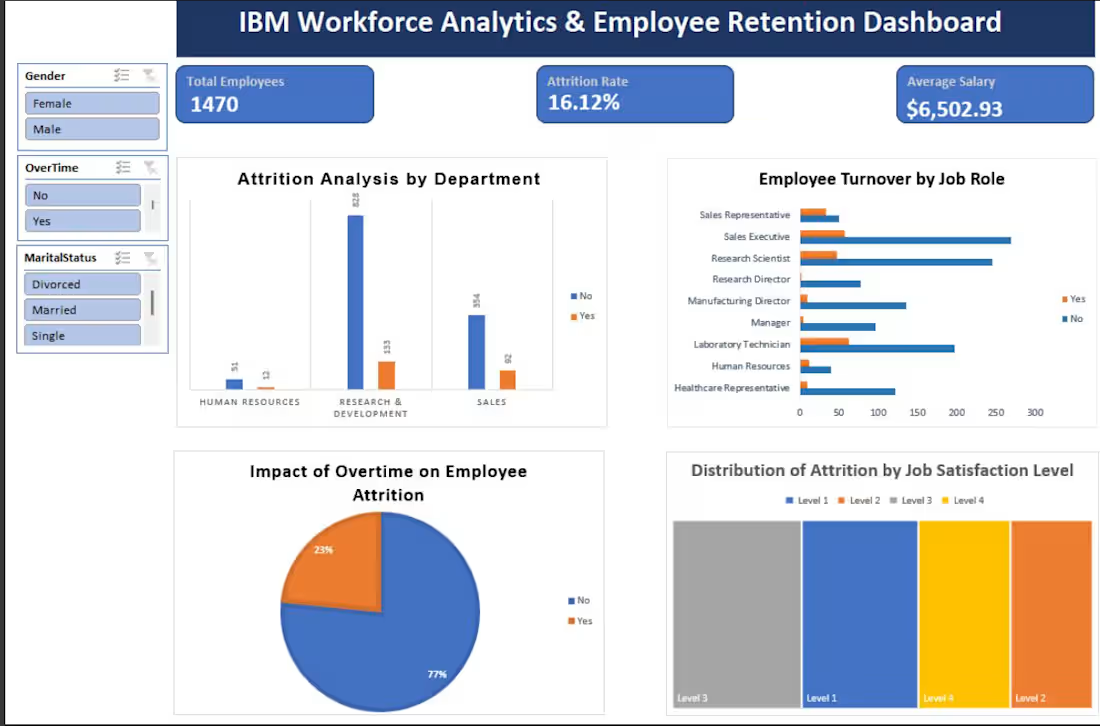
📊 Excited to share my latest Data Analysis project: IBM Workforce Analytics & Employee Retention Dashboard!
As a Freelance Data Analyst, I wanted to dive deep into human resource data to uncover the real drivers behind employee attrition and corporate turnover.
🔹 Technical Workflow:
Data Cleaning & Preparation: Leveraged advanced Excel to handle missing values, validate data types, and ensure data integrity.
Exploratory Data Analysis (EDA): Built complex Pivot Tables to cross-reference multiple variables (Department, Job Role, Overtime, and Satisfaction Levels).
Interactive Dashboard Design: Designed a dynamic executive dashboard with integrated Slicers (Gender, Overtime, Marital Status) for seamless, interactive filtering.
📉 Key Insights & Takeaways:
• Executive Metrics: Analyzed a workforce of 1,470 employees (Average Salary: $6,502.93) with an overall Attrition Rate of 16.12%.
• Departmental Impact: The Research & Development department holds the largest workforce but experiences the highest absolute turnover with 133 departures.
• The Overtime Risk: Employees working Overtime represent a critical risk factor, directly accounting for 23% of total attrition.
• Satisfaction Correlation: Departures are heavily concentrated among employees reporting low job satisfaction (Level 1 & Level 2).
🛠️ Tools Used: Microsoft Excel (Power Query, Pivot Tables, Advanced Charts, Slicers).
🔗 Check out the detailed repository and code on my GitHub: [https://github.com/AbdelhaqTheAnalyst/IBM-HR-Analytics-Dashboard ]
hashtag#DataAnalysis hashtag#DataAnalytics hashtag#ExcelDashboard hashtag#HRAnalytics hashtag#FreelanceDataAnalyst hashtag#DataDriven
0
10
Watch my End-to-End Supply Chain Executive Dashboard in action! 📊🎥
I processed over 180K global shipment records to build this premium, 3D-floating executive interface in Power BI. In this quick video, you can see how dynamic DAX measures allow C-level executives to drill down into operational bottlenecks and profit leaks with a single click.
🛠️ The Tech Stack behind this pipeline:
• Python (Pandas): Data cleansing & feature engineering.
• SQL Server: High-performance ETL pipeline.
• Power BI: Advanced DAX & modern UI/UX design.
💡 Crucial Business Insights demonstrated in the video:
1️⃣ Catastrophic Delays: Global delay rate is at 54.83%, heavily driven by Central Africa and South Asia logistics nodes.
2️⃣ Premium Failure: The express "First Class" option is failing with a staggering 95.32% delay rate.
3️⃣ Financial Bleeding: Total losses ($3.88M) almost wipe out net profits, massively leaked through the 'Fishing' category ($760K).
4️⃣ Fraud Hotspots: Western Europe leads global security alerts with 27.38% of total suspected fraud cases.
This isn't just a report; it's a decision-making tool built to save enterprise companies millions in operational costs.
💼 Open to worldwide remote Data Analyst roles! Check out my full code and documentation on GitHuB: https://github.com/AbdelhaqTheAnalyst/Supply-Chain-Data-Analytics-Project
hashtag#DataAnalytics (https://www.linkedin.com/search/results/all/?keywords=%23dataanalytics&origin=HASH_TAG_FROM_FEED) hashtag#PowerBI (https://www.linkedin.com/search/results/all/?keywords=%23powerbi&origin=HASH_TAG_FROM_FEED) hashtag#SQL (https://www.linkedin.com/search/results/all/?keywords=%23sql&origin=HASH_TAG_FROM_FEED) hashtag#SupplyChain (https://www.linkedin.com/search/results/all/?keywords=%23supplychain&origin=HASH_TAG_FROM_FEED) hashtag#RemoteJobs (https://www.linkedin.com/search/results/all/?keywords=%23remotejobs&origin=HASH_TAG_FROM_FEED) hashtag#Portfolio (https://www.linkedin.com/search/results/all/?keywords=%23portfolio&origin=HASH_TAG_FROM_FEED) hashtag#DataAnalyst (https://www.linkedin.com/search/results/all/?keywords=%23dataanalyst&origin=HASH_TAG_FROM_FEED)
0
14
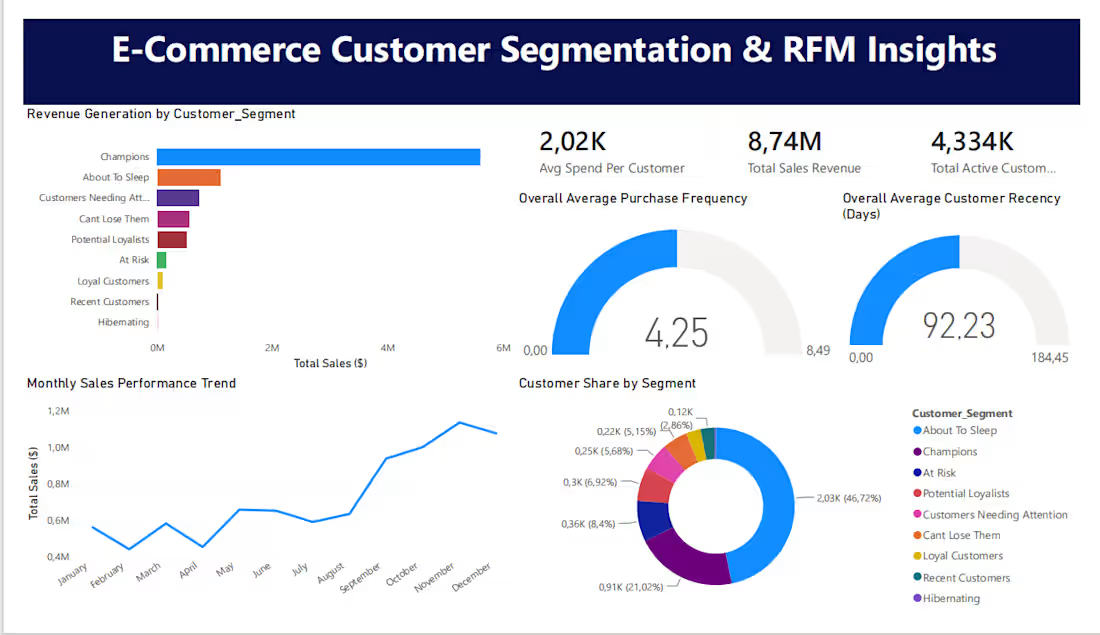
End-to-End E-Commerce Customer Segmentation & RFM Analytics Project! 🛒📊
I took a raw online retail dataset through a full data lifecycle—from intensive Python ETL processes to advanced database architecture and strategic business storytelling.
🛠️ Technical Workflow & Implementation:
1️⃣ Python/Pandas: Handled over 135K missing Customer IDs by isolating guest checkouts to ensure RFM accuracy. Eliminated 5,000+ duplicate records, resolved text formatting conflicts, and engineered clean date/hour features.
2️⃣ SQL Server (T-SQL): Hosted data in a local DB. Implemented layered CTEs and advanced NTILE(5) Window Functions to automatically classify customers into precise 1-to-5 tiers based on Recency, Frequency, and Monetary metrics. Used complex CASE WHEN statements to map 3-digit RFM codes into executive-friendly business segments.
3️⃣ Power BI: Designed a premium, non-cluttered Executive Dashboard utilizing strategic Cross-Filtering relationships. Engineered comparative Horizontal Bar charts, dynamic Donut segment distributions, continuous Line performance trends, and precise KPI Gauge counters.
🔑 Key Portfolio Insights & Executive Summary:
• Retention Alarm & High Churn Risk: The overall store average recency stands at 92.23 days, combined with the fact that 'About To Sleep' is the largest customer segment by count. This indicates that while the store successfully acquires customers, it struggles with long-term retention.
• Extreme Q4 Seasonality: The sales performance trend reveals a massive, vertical spike in sales during October, November, and December, with November generating exponential revenue compared to the rest of the year due to holiday shopping.
• Low Purchase Frequency Baseline: The average customer purchases only 4.25 times over the entire timeline, showing that repeat-buying habits are heavily seasonal rather than consistent.
💡 Strategic Recommendation:
The marketing team must scale paid advertising starting mid-September and October to capture leads early and build retargeting audiences before holiday ad costs peak. Implement an automated marketing workflow that triggers a personalized reactivation coupon exactly 90 days after a customer's last purchase to stop them from churning.
📂 For more deep insights, documentation, marketing action plans, and full clean scripts, check my GitHub repository:https://github.com/AbdelhaqTheAnalyst/E-Commerce-Customer-segmentation-RFM
0
16