
Quzmo Studios
We don’t make interfaces. We make UI companions
New to Contra
Quzmo is building their profile!
DataVex | Premium Interactive Charts for Framer
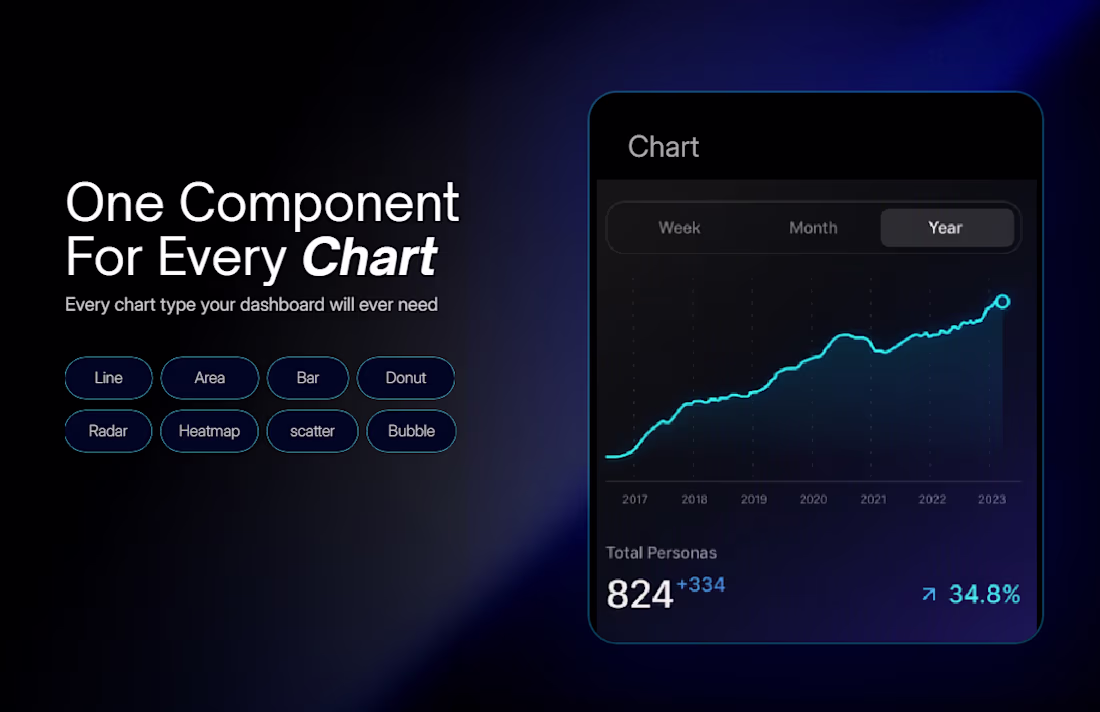
Stop settling for static, lifeless data. DataVex is the ultimate enterprise-grade charting engine built natively for Framer. Transform raw CSV or JSON into breathtaking, interactive dashboards without writing a single line of code. Whether you are designing a complex SaaS analytics portal, a Web3 investor deck, or a high-converting agency portfolio, DataVex turns raw metrics into a living, breathing narrative.
🌟 Core Features
• 10 Enterprise Chart Types: Line, Area, Stacked, Vertical/Horizontal Bars, Scatter, Bubble, Donut, Radar, and GitHub-style Heatmaps.
• Smart Math Engine: Instantly toggle between Raw, Cumulative, MoM%, QoQ%, and Rolling Averages on the fly.
• Interactive Range Selectors: Let users drag, pan, and zoom into specific data slices with physics-based handles.
• Premium Polish: Glassmorphic tooltips, spring-physics animated big numbers, line glows, and multi-stop area gradients.
• Zero-Config Parsing: Just paste your CSV or JSON directly. No complex array formatting required.
⚡ Performance & Accessibility
Built with viewport-triggered animations and reduced-motion support, DataVex respects user accessibility settings while maintaining buttery-smooth 60fps rendering. Fully responsive out of the box, it scales flawlessly from mobile widgets to 4K dashboard monitors.
🔌 Seamless Integration
DataVex integrates flawlessly with Framer's native CMS and third-party APIs like Airtable or Xano. Map your dynamic content fields directly to the chart axes, enabling real-time, auto-updating visualizations for your clients without external scripts.
🎯 Perfect For
SaaS Founders, Product Designers, and Framer Agencies needing investor-ready metrics and beautiful UI kits.
📦 What Is Included
• 1x Master DataVex Framer Component
• Lifetime Updates & Premium Support
• Comprehensive Documentation
Elevate your data storytelling. Add DataVex to your canvas and build beautiful dashboards your users truly love exploring!!
0
3