
Interface for Data VisualizationGeorge Railean
I specialize in creating intuitive Data Visualization Interfaces that turn complex datasets into actionable insights. My goal is to empower businesses by presenting data in a way that is easy to understand, explore, and act upon.
With a focus on clarity and usability, I design interactive dashboards and visualizations that help users quickly identify patterns, trends, and key metrics. Whether you're looking to create real-time data visualizations, interactive reports, or advanced charts, my solutions are tailored to meet your specific needs.
Key Features:
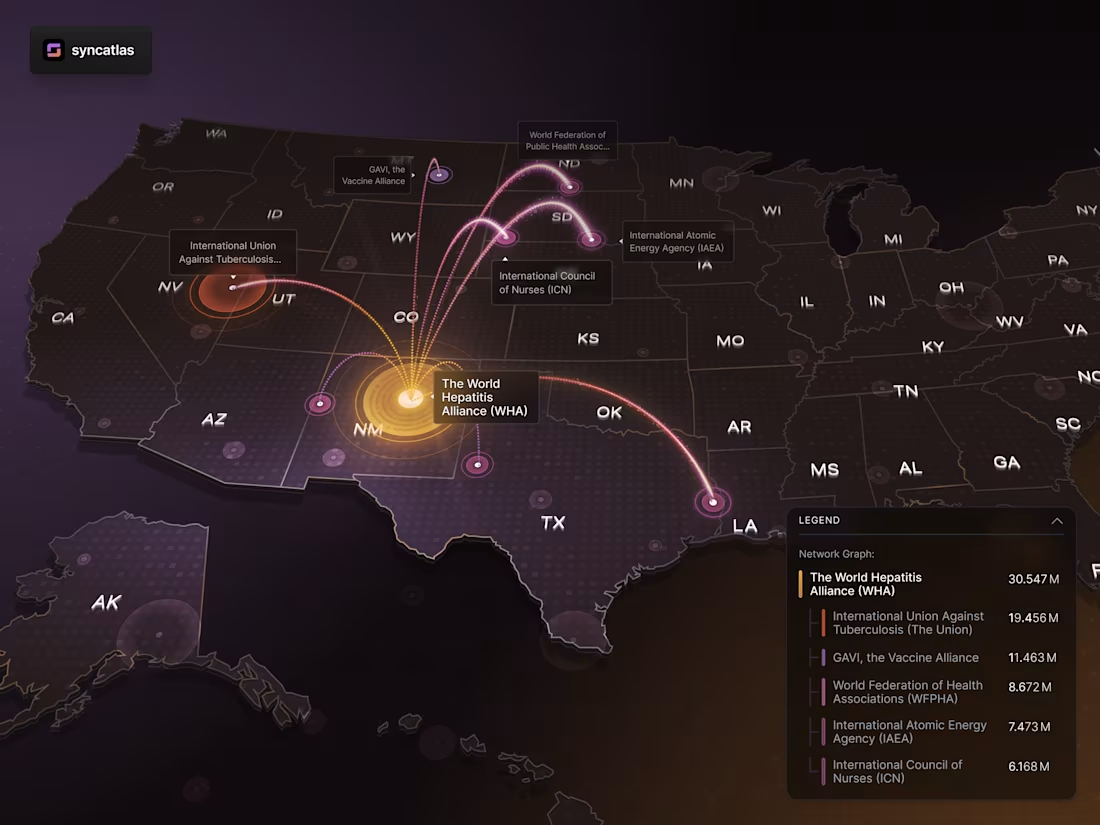
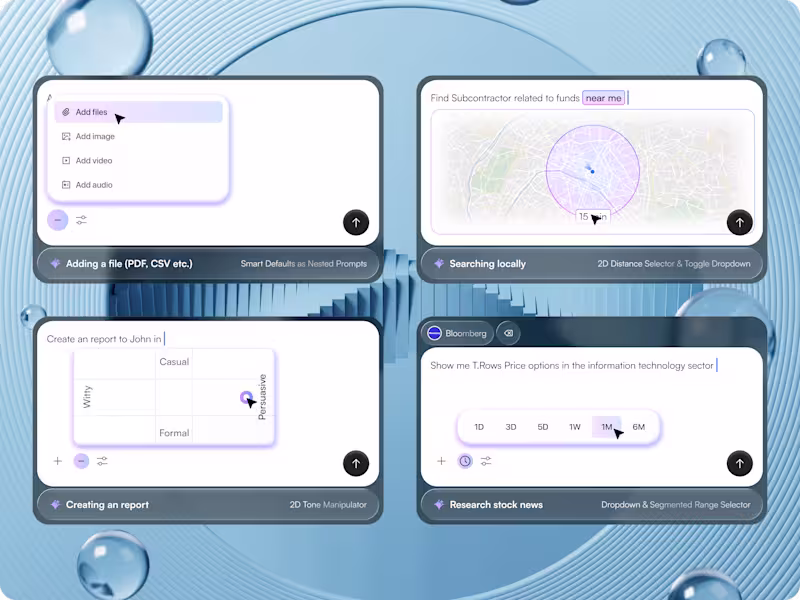
Interactive Dashboards: Custom dashboards that allow users to engage with real-time data and personalize their view.
Advanced Charts & Graphs: Dynamic charts that offer deep insights and enable data exploration with ease.
User-Centric Design: A focus on making data interaction intuitive and accessible to all users.
Scalable Solutions: Flexible designs that adapt as your data grows and becomes more complex.
Let’s transform your data into a visual story that is not only informative but also inspiring and easy to navigate.
George's other services

Starting at$130
Duration1 week
Tags
Product Designer
datavisualization
userinterface
Service provided by
George Railean Merrifield, USA
- 5
- Followers
Interface for Data VisualizationGeorge Railean
Starting at$130
Duration1 week
Tags
Product Designer
datavisualization
userinterface
I specialize in creating intuitive Data Visualization Interfaces that turn complex datasets into actionable insights. My goal is to empower businesses by presenting data in a way that is easy to understand, explore, and act upon.
With a focus on clarity and usability, I design interactive dashboards and visualizations that help users quickly identify patterns, trends, and key metrics. Whether you're looking to create real-time data visualizations, interactive reports, or advanced charts, my solutions are tailored to meet your specific needs.
Key Features:
Interactive Dashboards: Custom dashboards that allow users to engage with real-time data and personalize their view.
Advanced Charts & Graphs: Dynamic charts that offer deep insights and enable data exploration with ease.
User-Centric Design: A focus on making data interaction intuitive and accessible to all users.
Scalable Solutions: Flexible designs that adapt as your data grows and becomes more complex.
Let’s transform your data into a visual story that is not only informative but also inspiring and easy to navigate.
George's other services
$130