
Excel and Data AnalysisNehali Bagwe
I offer simple and efficient Excel and data analysis services, including cleaning, organizing, and visualizing data to help you make informed decisions. What sets me apart is my focus on delivering clear, actionable insights using easy-to-understand charts and reports, with a personalized approach that caters to your specific needs and goals.
What's included
Data Cleaning and Preprocessing
Removing duplicates, inconsistencies, and formatting issues in data.
Handling missing or incomplete data by filling in values, deleting rows, or using interpolation.
Data Organization
Structuring data into useful tables, pivot tables, or charts for easy analysis.
Categorizing and grouping data based on specific criteria.
Statistical Analysis
Performing descriptive statistics such as mean, median, standard deviation.
Hypothesis testing and regression analysis for deeper insights.
Correlation and trend analysis.
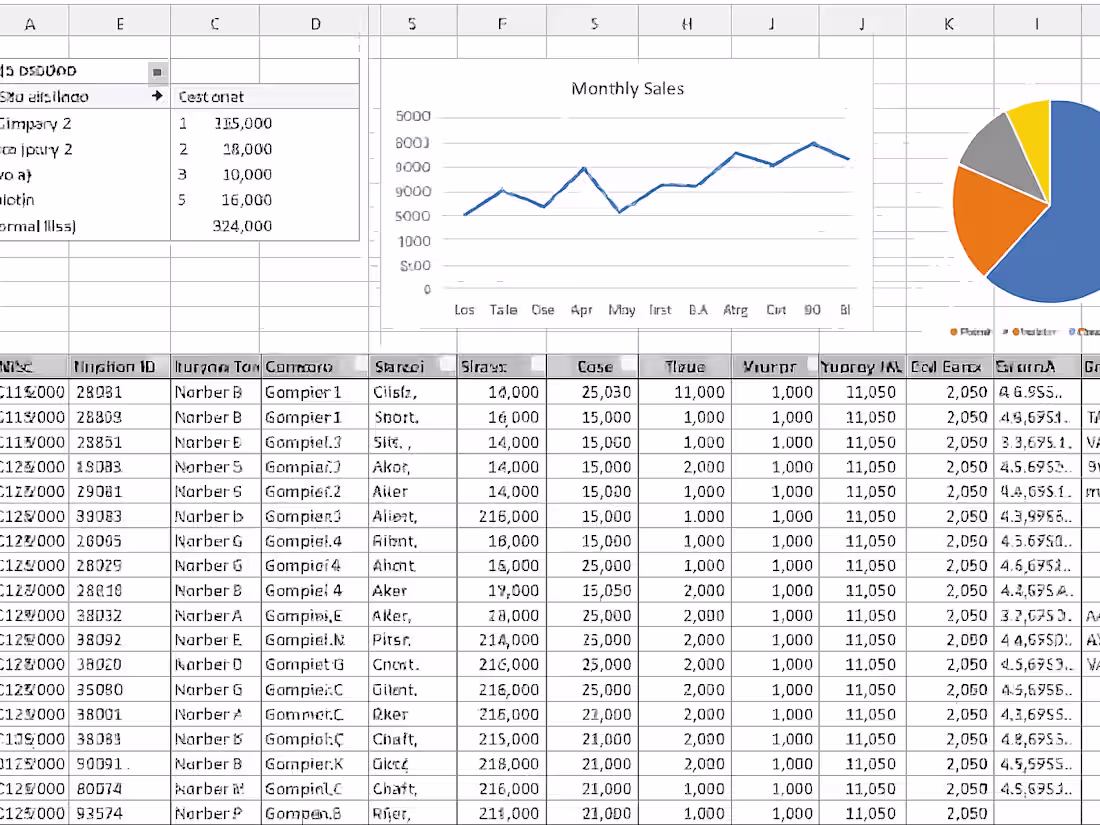
Visualization
Creating charts, graphs, and dashboards using Excel (bar, line, pie charts, etc.).
Building interactive Excel dashboards for better visualization of key metrics.
Using Power BI (in combination with Excel) for more advanced visualizations.
Forecasting and Trend Analysis
Using historical data to predict future trends (time series forecasting).
Implementing regression models or moving averages to forecast sales, expenses, etc.
Automation with Macros and VBA
Automating repetitive tasks with Excel macros.
Writing custom VBA (Visual Basic for Applications) scripts for advanced automation and reporting.
Financial Modeling
Creating budget templates, financial forecasts, and models for financial analysis.
Analyzing cost structures, profits, and ROI (return on investment).
Advanced Excel Functions
Using functions like VLOOKUP, INDEX/MATCH, SUMIF, COUNTIF, and other advanced formulas for data manipulation.
Implementing array formulas and nested functions for more complex analysis.
Reporting and Presentation
Generating reports with meaningful insights and recommendations.
Presenting data analysis results in a clear and concise manner using Excel.
Nehali's other services

Starting at$10 /hr
Tags
Excel VBA
Microsoft Excel
Project Manager
Service provided by
Nehali Bagwe Surrey, Canada
Excel and Data AnalysisNehali Bagwe
Starting at$10 /hr
Tags
Excel VBA
Microsoft Excel
Project Manager
I offer simple and efficient Excel and data analysis services, including cleaning, organizing, and visualizing data to help you make informed decisions. What sets me apart is my focus on delivering clear, actionable insights using easy-to-understand charts and reports, with a personalized approach that caters to your specific needs and goals.
What's included
Data Cleaning and Preprocessing
Removing duplicates, inconsistencies, and formatting issues in data.
Handling missing or incomplete data by filling in values, deleting rows, or using interpolation.
Data Organization
Structuring data into useful tables, pivot tables, or charts for easy analysis.
Categorizing and grouping data based on specific criteria.
Statistical Analysis
Performing descriptive statistics such as mean, median, standard deviation.
Hypothesis testing and regression analysis for deeper insights.
Correlation and trend analysis.
Visualization
Creating charts, graphs, and dashboards using Excel (bar, line, pie charts, etc.).
Building interactive Excel dashboards for better visualization of key metrics.
Using Power BI (in combination with Excel) for more advanced visualizations.
Forecasting and Trend Analysis
Using historical data to predict future trends (time series forecasting).
Implementing regression models or moving averages to forecast sales, expenses, etc.
Automation with Macros and VBA
Automating repetitive tasks with Excel macros.
Writing custom VBA (Visual Basic for Applications) scripts for advanced automation and reporting.
Financial Modeling
Creating budget templates, financial forecasts, and models for financial analysis.
Analyzing cost structures, profits, and ROI (return on investment).
Advanced Excel Functions
Using functions like VLOOKUP, INDEX/MATCH, SUMIF, COUNTIF, and other advanced formulas for data manipulation.
Implementing array formulas and nested functions for more complex analysis.
Reporting and Presentation
Generating reports with meaningful insights and recommendations.
Presenting data analysis results in a clear and concise manner using Excel.
Nehali's other services
$10 /hr