
Data analysis | Python |SQL | Excel | Tableau | Power BINazmul Islam Rakin
I offer tailored data analysis solutions, turning raw data into strategic insights with expertise in SQL, Python, Power BI, Tableau, and Excel. My strength lies in creating dynamic, interactive dashboards and performing deep analysis to simplify complex data, helping businesses take impactful actions for growth.
What's included
Data modeling
Data extraction from different data sources (.xlsx, .csv, SQL database, etc)
Data processing
Data will go through ETL (extract, transform, load) for better analysis procedure
In-Depth Data Analysis
A in-depth statistical analysis will be performed with your preferred technologies (SQL/Python/Power BI/Tableau/Excel)
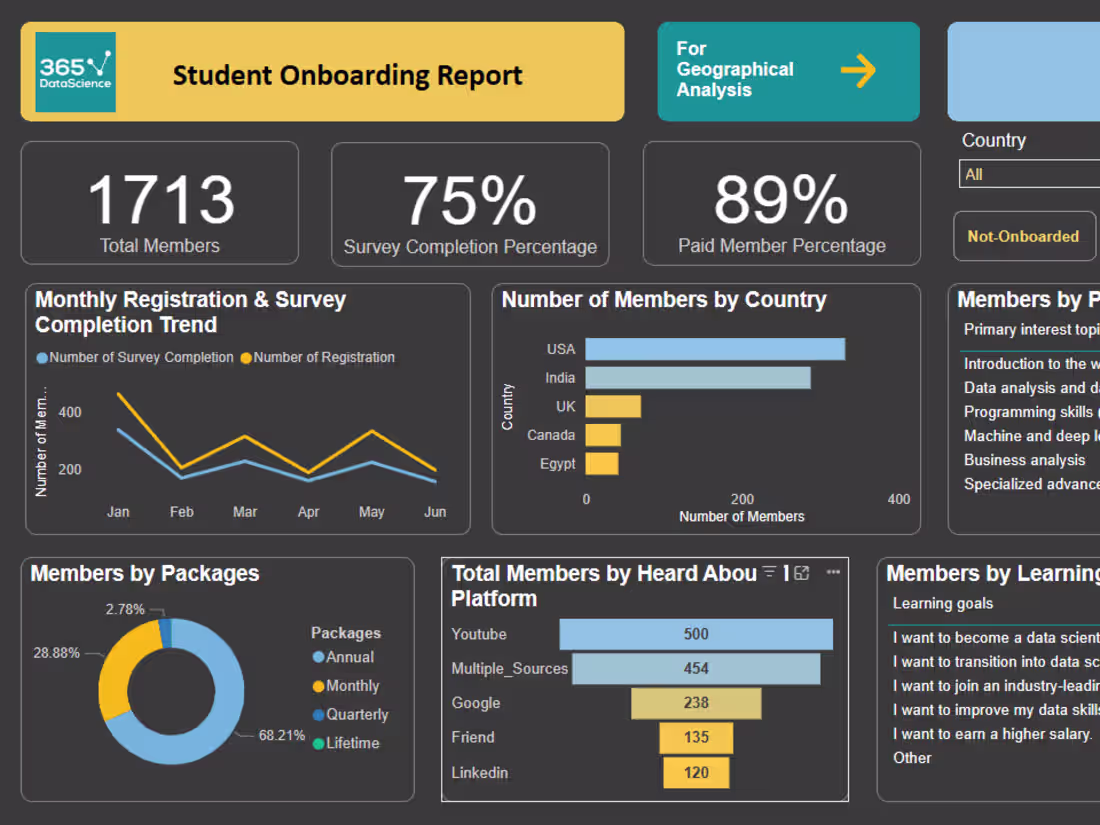
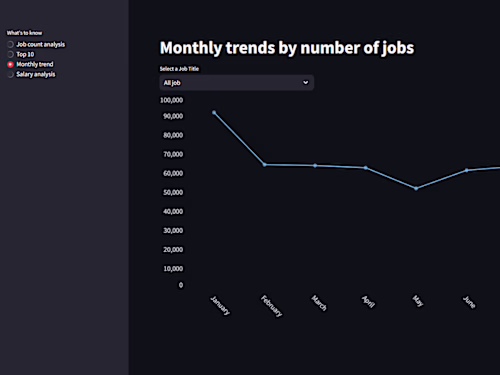
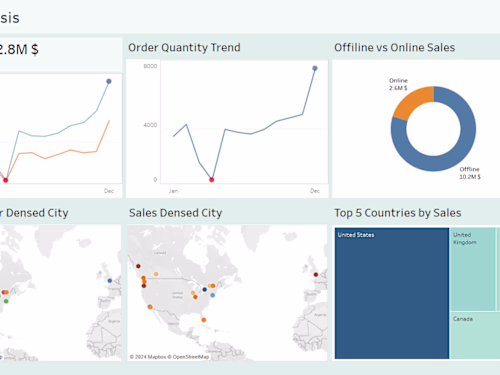
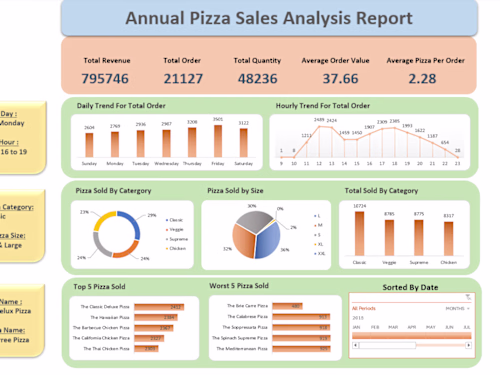
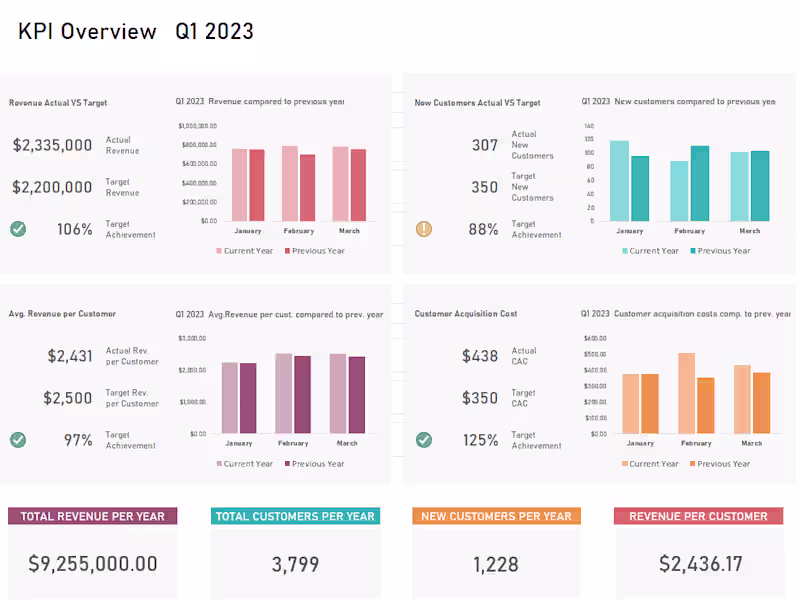
Data Visualizations Dashboard
Visualization, including charts, graphs, and dashboards, to effectively convey the data insights. Options include interactive dashboards created with tools like Tableau and Power BI or custom visualizations in Python libraries like Seaborn and Plotly, tailored to your preferences.
Post-delivery support
I offer post-delivery support for any adjustments or minor corrections. I’m committed to making sure you’re completely satisfied with the final result.
Nazmul Islam's other services
Starting at$25 /hr
Tags
Microsoft Excel
Microsoft Power BI
pandas
Python
Tableau
Data Analyst
Data Scientist
Data Visualizer
Service provided by
Nazmul Islam Rakin Dhaka, Bangladesh
- 1
- Followers
Data analysis | Python |SQL | Excel | Tableau | Power BINazmul Islam Rakin
Starting at$25 /hr
Tags
Microsoft Excel
Microsoft Power BI
pandas
Python
Tableau
Data Analyst
Data Scientist
Data Visualizer
I offer tailored data analysis solutions, turning raw data into strategic insights with expertise in SQL, Python, Power BI, Tableau, and Excel. My strength lies in creating dynamic, interactive dashboards and performing deep analysis to simplify complex data, helping businesses take impactful actions for growth.
What's included
Data modeling
Data extraction from different data sources (.xlsx, .csv, SQL database, etc)
Data processing
Data will go through ETL (extract, transform, load) for better analysis procedure
In-Depth Data Analysis
A in-depth statistical analysis will be performed with your preferred technologies (SQL/Python/Power BI/Tableau/Excel)
Data Visualizations Dashboard
Visualization, including charts, graphs, and dashboards, to effectively convey the data insights. Options include interactive dashboards created with tools like Tableau and Power BI or custom visualizations in Python libraries like Seaborn and Plotly, tailored to your preferences.
Post-delivery support
I offer post-delivery support for any adjustments or minor corrections. I’m committed to making sure you’re completely satisfied with the final result.
Nazmul Islam's other services
$25 /hr